
From 2026-Q2 to 2026-Q3
WORKSHOP OVERVIEW
From a metric answer to a business investigation
“Sales increased, but Profit decreased. Which categories contributed most, and what patterns help explain the change?”
Over the same two complete quarters
Find contributors, test a pricing option and recommend action.
Core purpose
A direct totals question tells us what changed. Deep Insights (DI) uses the business context in OAC to plan a broader investigation: identify sources, query governed data, assess intermediate results, optionally calculate with Python and assemble a structured answer. The lab shows how to inspect those steps and use the findings for a decision.
THE WORKSHOP STORY
From a surprising result to an informed action
Follow the four steps to see what you will investigate and achieve.
01 · THE BUSINESS PROBLEM
Sales rose. Profit fell. What changed?
BrightMart sold more in Q3, yet earned less gross product Profit. A totals table establishes the gap; it does not identify the categories or segments behind it.
Your goal: move from “what happened?” to “where should we investigate?”
Sales↑ $296,390
Q2$1.07m
Q3$1.37m
Gross product Profit↓ $66,360
Q2$308.8k
Q3$242.4k
02 · THE QUESTION GETS HARDER
The totals cannot tell the whole story
Both agents answered the direct quarter totals. The broader BrightMart prompt asks for contributors, a segment drill-down and a supported interpretation. In the recorded Data Agent run, that prompt stopped at a scope response.
This is where the lab turns to Deep Insights: investigate the complex question using the prepared OAC business context.
03 · WATCH THE INVESTIGATION
Deep Insights follows the evidence
DI can plan a sequence, use governed OAC queries, inspect intermediate results and refine the analysis. In this lab it moves from the company change to categories, then West / Online Laptops.
Your job: inspect Thinking Events and check that the reported figures support the conclusion.
04 · TURN INSIGHT INTO ACTION
Leave with a supported recommendation
Use the diagnosis to prioritize the segment, test a pricing option under stated assumptions and monitor Profit against regional targets. The report is a starting point for a business decision, with figures you can verify.
By the end, you can explain when DI adds value, how it reached an answer and what action the evidence supports.
Participant outcome: Five guided prompts connect direct answers, multi-step diagnosis, optional Python, multiple sources and policy context to a practical action plan.
Instructor introduction, 60 seconds
“You have already invested in business terms, measures and relationships in OAC. Today we will see how that context supports an agent that can investigate a complex question. BrightMart gives us a simple case: Sales rose, but Profit fell. First we will see how the agent was prepared. Then you will use the existing agent to investigate the cause, compare it with a Data Agent and examine the evidence behind its recommendation.”
Session plan
| Time | Who | What happens |
|---|---|---|
| 0–15 min | Instructor | Explain the problem, dataset and prepared configuration with screenshots. |
| 15–22 min | Business owners and key stakeholders | Open the existing agents and find the chat controls. |
| 22–60 min | Business owners and key stakeholders | Run five prompts and compare observed evidence. |
| 60–75 min | Business owners and instructor | Inspect Thinking Events, Python, download/debug, feedback and Console usage; agree on the conclusion. |
| 75–90 min | Everyone | Questions and application to customer data. |
How this guided path works: The instructor explains agent creation and configuration using captured OAC screens. The participants' hands-on work starts with an existing BrightMart agent and five tested prompts. The same preparation pattern can be applied to indexed OAC subject areas, including Fusion Data Intelligence (FDI) and custom subject areas; this BrightMart exercise uses synthetic datasets rather than a live FDI subject area.
Profit here is Sales minus product acquisition Cost; it is not company net income. The screenshots show an observed aiw2 run from 14 October 2026. Agent wording and tool routes can differ by model and environment.
Explore the Deep Insights capability →DEEP INSIGHTS CAPABILITIES
What makes this an analytical agent?
A totals question is only the starting point. The business decision needs a sequence of related checks, calculations and evidence review.
Data Agent and DI answer the same direct quarterly question. This checks the measures before discussing more complex behavior.
With the same broad prompt, the observed Data Agent stopped at a scope response; DI continued from company change to category and segment contributors, then synthesized the evidence. This is a comparison of these configured agents in this lab.
DI uses retrieved governed totals for a transparent discount sensitivity. Python ran in the observed scenario; it is not required for every question.
DI uses separate actuals and regional targets, matching them only at Quarter × Region grain.
The agent compares an observed discount with a retrieved policy rule. RAG is also available to the Data Agent; DI's added value here is the combined investigation.
Inspect Thinking Events for source selection, Logical SQL, governed results and optional Python. Read the report as an analytical recommendation and verify its figures.
Which agent fits the question?
| Business need | Data Agent in this lab | Deep Insights in this lab |
|---|---|---|
| “Show Sales and Profit by Quarter.” | Direct, concise metric answer. | Also answers; the same totals establish a trusted baseline. |
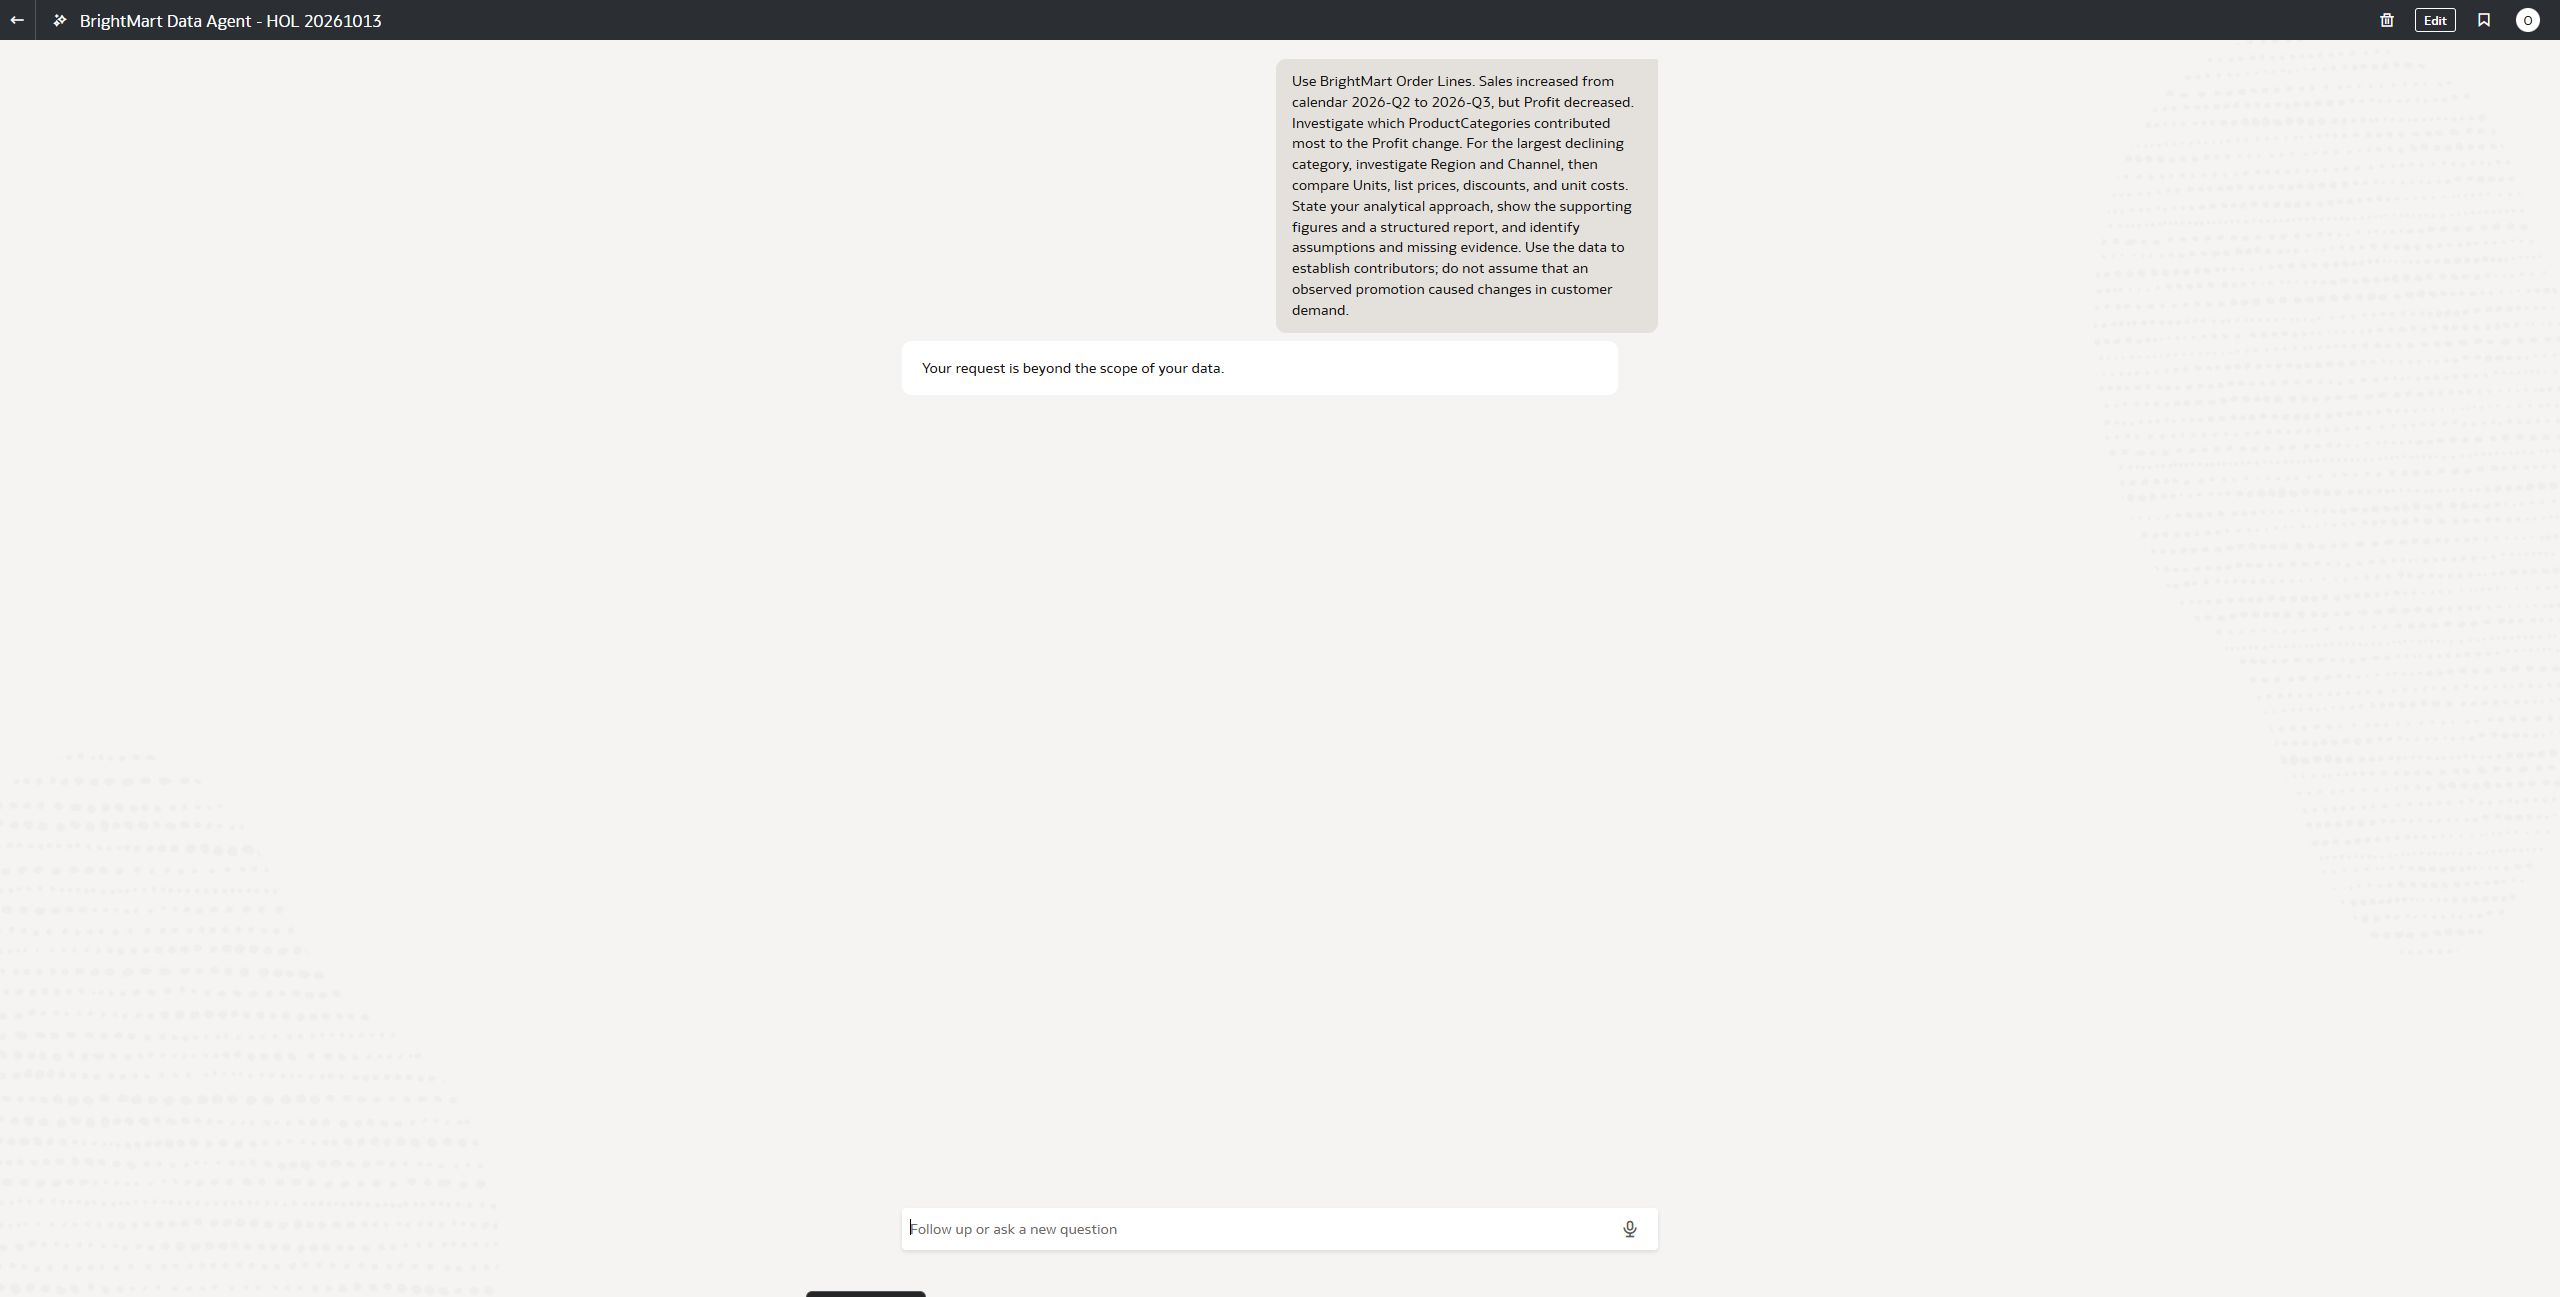
| “Why did Profit fall, and where should we act?” | Answered the direct totals, but returned “Your request is beyond the scope of your data” for this broad diagnostic prompt in the observed run. Narrower follow-ups remain possible. | Planned successive company, category and segment comparisons, then produced a structured, evidence-based recommendation in the observed run. |
| “What if we change the discount?” | The observed answer returned actuals but no scenario table. | Used governed actuals and an observed Python step for fixed-volume calculations. |
| “What does policy say?” | Retrieved the policy document. | Also retrieved the policy; combined it with order evidence in a report. |
Instructor explanation
“Both agents answered our direct totals question. When we asked the same broad diagnostic question, this Data Agent stopped with a scope response. Deep Insights took the question through successive comparisons: company, category and segment. Its value here is carrying out that investigation and showing the evidence in a structured answer. We still verify the queries, numbers and reasoning trail before acting.”
Both Instant and Research modes can reason. Mode, selected model and reasoning effort are separate controls. DI does not remove the need for indexing or sound business definitions. The video demonstration and the observed aiw2 cases are the basis for this feature tour.
Meet the data →WHAT EACH SOURCE CONTAINS
Meet the BrightMart data
The dataset is small enough to explain, but rich enough for a real multi-step investigation.
2026-Q2 and Q3; one completed item line per OrderLineID.
One TargetProfit value for each Quarter × Region.
Standard discounts up to 20%; above that requires documented approval.
What one actual order line looks like
| OrderLineID | Quarter | Region | Channel | Category | Units | List price | Discount | Sales | Cost | Profit |
|---|---|---|---|---|---|---|---|---|---|---|
| BM-L-002268 | 2026-Q3 | West | Online | Laptops | 1 | $1,000 | 30% | $700 | $790 | −$90 |
Read this row: one laptop sold for $700 after a $300 discount, while its product cost was $790. This line has −$90 gross product Profit. The investigation aggregates many such lines; this row alone does not establish the company result or what caused demand.
OrderID can repeat across lines. Count distinct OrderID for orders. UnitListPrice, UnitCost and DiscountRate are attributes; summing them gives no useful business total.
Instructor points to make
See how the lab is prepared →Show why “Sales up, Profit down” is possible: volume can grow while discount and unit cost change. Explain the difference between an observed pattern, a fixed-volume calculation, a policy rule and an unobserved approval or causal claim.
PREPARATION AND PARTICIPATION
How the experience is prepared and used
Business definitions and platform setup are prepared before the session. Business owners and key stakeholders carry out the hands-on investigation.
Domain expert
A retail finance or commercial specialist decides what the numbers mean and what decision the lab should support.
- Defines Profit, target grain, quarters, discount rules and valid comparisons.
- Reviews and corrects synonyms, generated AI Descriptions, agent instructions and the policy wording.
- Checks expected answers and approves the five example questions.
Hand-off: reviewed definitions and a trusted answer key for the agent author.
OAC administrator and agent author
The administrator enables the feature, models and access. An authorized agent author assembles the prepared experience; the author may be a domain expert or analytics specialist.
- Imports and indexes sources, saves synonyms/descriptions, builds and shares the two agents.
- Attaches the policy and regional targets; verifies permissions and readiness.
- Monitors AIDP Unit usage and, where available, service logs.
Hand-off: working named agents visible to the assigned workshop users.
Business owners and key stakeholders
In OAC access terminology, they are agent users. Their workshop task is to investigate a business decision using agents prepared for them.
- Open the existing Data Agent and DI Agent; run five prompts.
- Compare direct answers with DI's investigation and inspect the visible tool trail.
- Validate figures, record a recommendation and decide what to test or review next.
Hand-off: a supported diagnosis and action plan, not a new dataset or agent.
Preparation sequence
The domain expert establishes the business meaning of the data. The OAC administrator and authorized agent author prepare the sources, access and agent. Business owners and key stakeholders then use the agent to investigate the question and decide what to do next.
These are workshop responsibilities, not fixed OAC application-role names. An agent user also needs the appropriate agent and underlying data access. This lab grants no permissions and changes no configuration.
Review the configuration →PRECONFIGURED CONFIGURATION WALKTHROUGH
How the agent was prepared in OAC
Explore ten illustrated setup steps. Each step explains where the setting is, what it does and what the captured screen shows. These settings are already in place for participant practice.
Why the business context matters
For a reliable investigation, the agent needs discoverable data and clear business meaning. The prepared BrightMart agent has four complementary context layers:
The indexed source exposes selected names and values. Synonyms connect a question such as “revenue” to the Sales field. The dataset owner prepares this; a missing or stale index can prevent source or value matching.
Reviewed descriptions say that Profit is Sales minus product Cost, DiscountRate is a per-line rate, and each actual row is one order line. The domain expert corrects generated drafts; an incorrect definition can produce a convincing but wrong comparison.
The agent author records analysis guidance: compare the same quarters, respect the source grain, and state assumptions. These instructions shape the investigation; they do not repair a wrong measure or create missing source data.
The attached promotion policy supplies the approval threshold through retrieval augmented generation (RAG). The author uploads it and confirms Ready/Enabled; the agent must still retrieve the relevant passage before applying the rule.
What the layers enable in this lab
The agent can identify Sales and Profit, interpret their definitions, investigate category and segment changes, and apply a separate policy rule. The ten screenshots below show how the preparation was completed. Participants use the prepared agent to test the outcome.
Where indexing is configured
| OAC source | How to configure its index | Who prepares it for this lab |
|---|---|---|
| Dataset, such as BrightMart Order Lines | Open the dataset from Home or Data, choose Actions → Inspect → Search. Use Settings for Index Dataset For, Scope for searchable fields and synonyms, and AI Descriptions for business meaning. Save and Run Now. | Dataset owner or authorized editor |
| Subject area, including FDI or a custom subject area | Open Navigator → Console → Search Index → Data Model. Select the subject area and columns for Assistants, set synonyms and crawl options, save and run the index. | OAC administrator |
Note: Subject areas are indexed from Search Index in the Console. Do not look for a dataset's Inspect → Search screen when preparing a subject area. The screenshots below show the BrightMart dataset path; the subject-area path is documented for applying the same principle to existing OAC/FDI models. Oracle subject-area indexing instructions ↗
How to use this tour: The instructor can show the key screens in 15 minutes. The written steps explain every setting for later reference. The hands-on portion begins at Open the prepared agent.
PRECONFIGURED · CONFIGURATION GUIDE 01
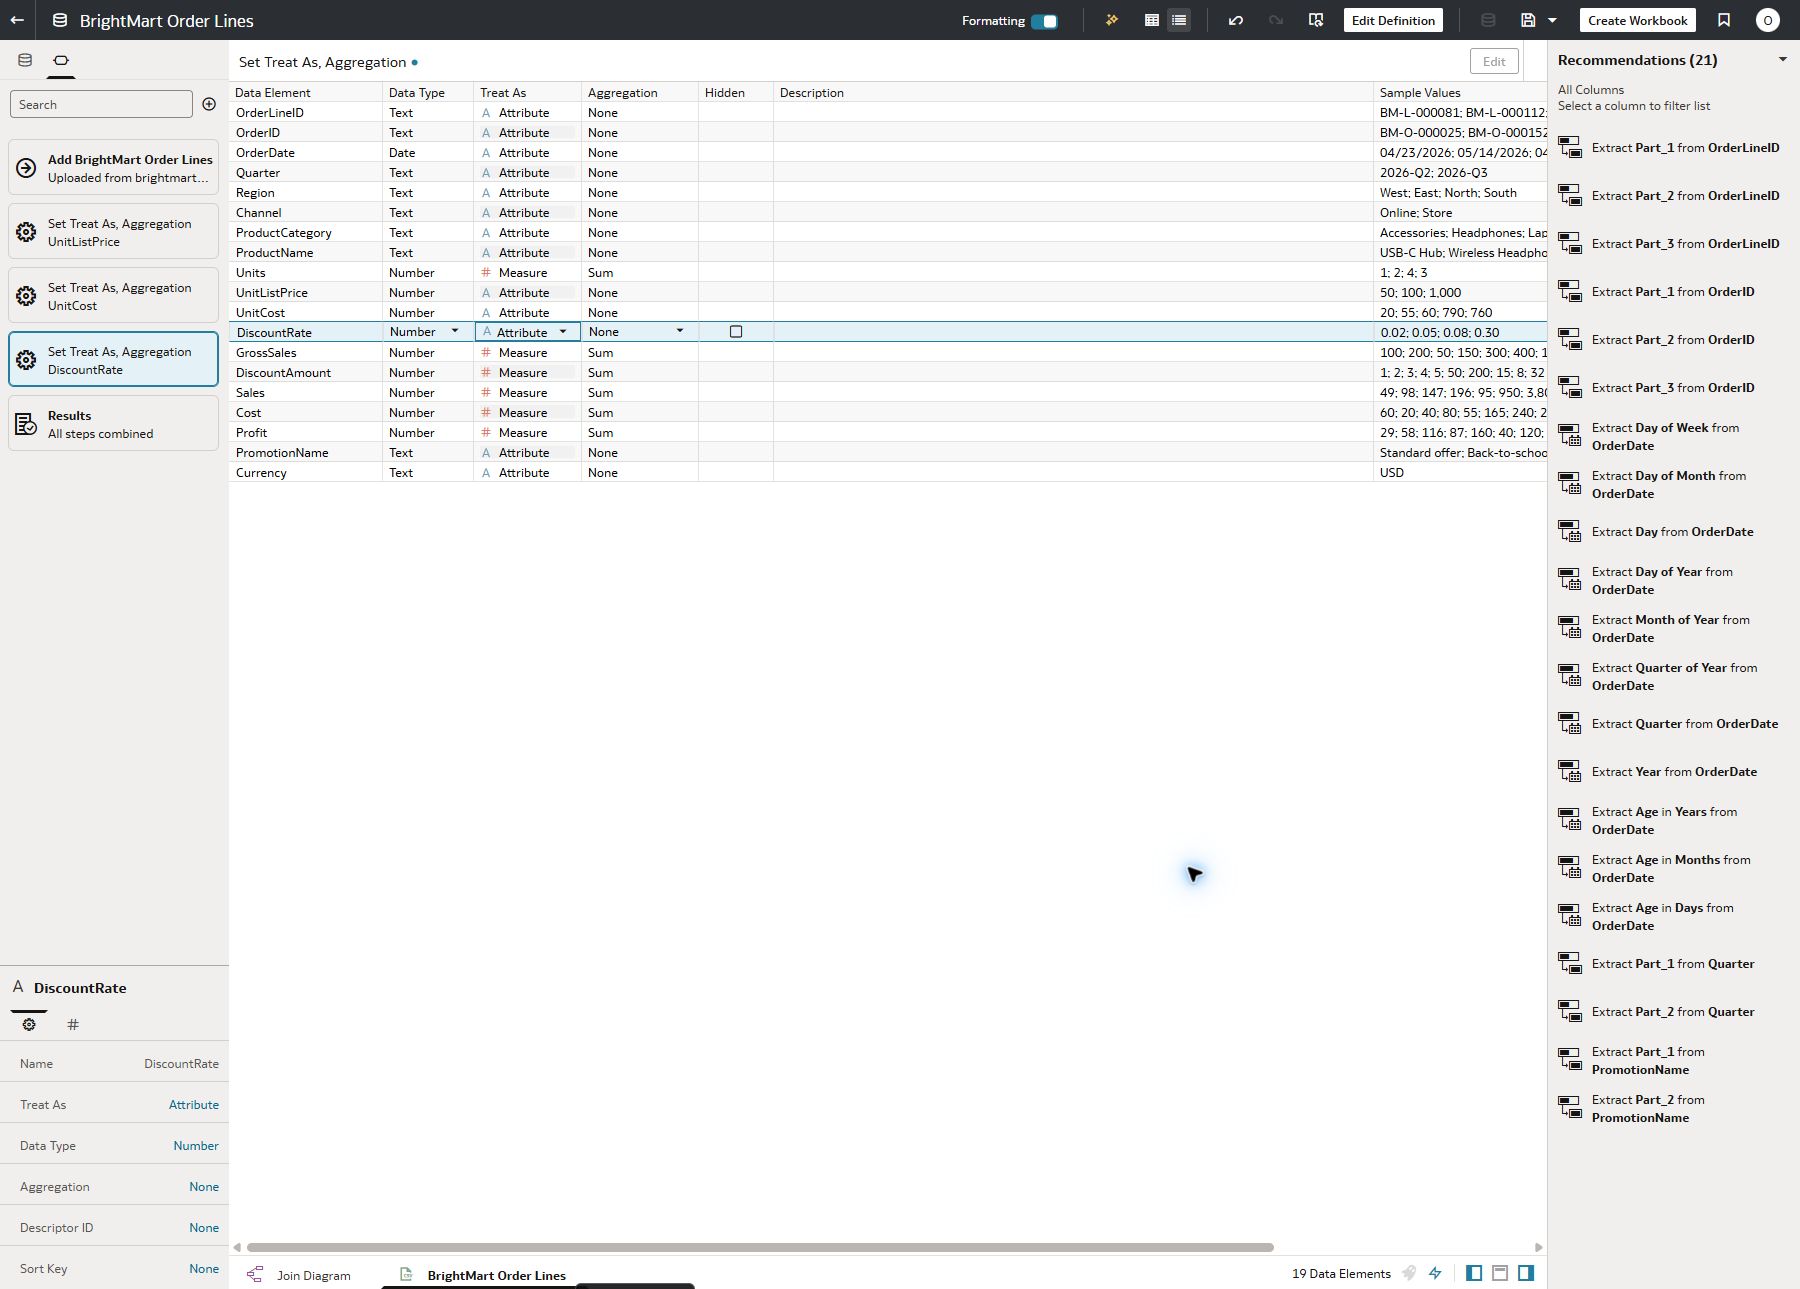
Check the data model
Navigation path
Home or Data page → BrightMart Order Lines → Actions → Inspect → Data
How to configure it: To review the dataset, open BrightMart Order Lines and choose Actions → Inspect → Data. Confirm that Sales, Cost, Profit, Units, GrossSales and DiscountAmount are additive measures. Keep OrderLineID, OrderID, UnitListPrice, UnitCost and DiscountRate as attributes.
Why this step matters: The agent's later comparisons depend on a correct measure definition. Summing unit prices or discount percentages would give a misleading result.
Check in the screenshot: Profit is Sales minus Cost; an order can have several lines, so order count uses distinct OrderID.
PRECONFIGURED · CONFIGURATION GUIDE 02
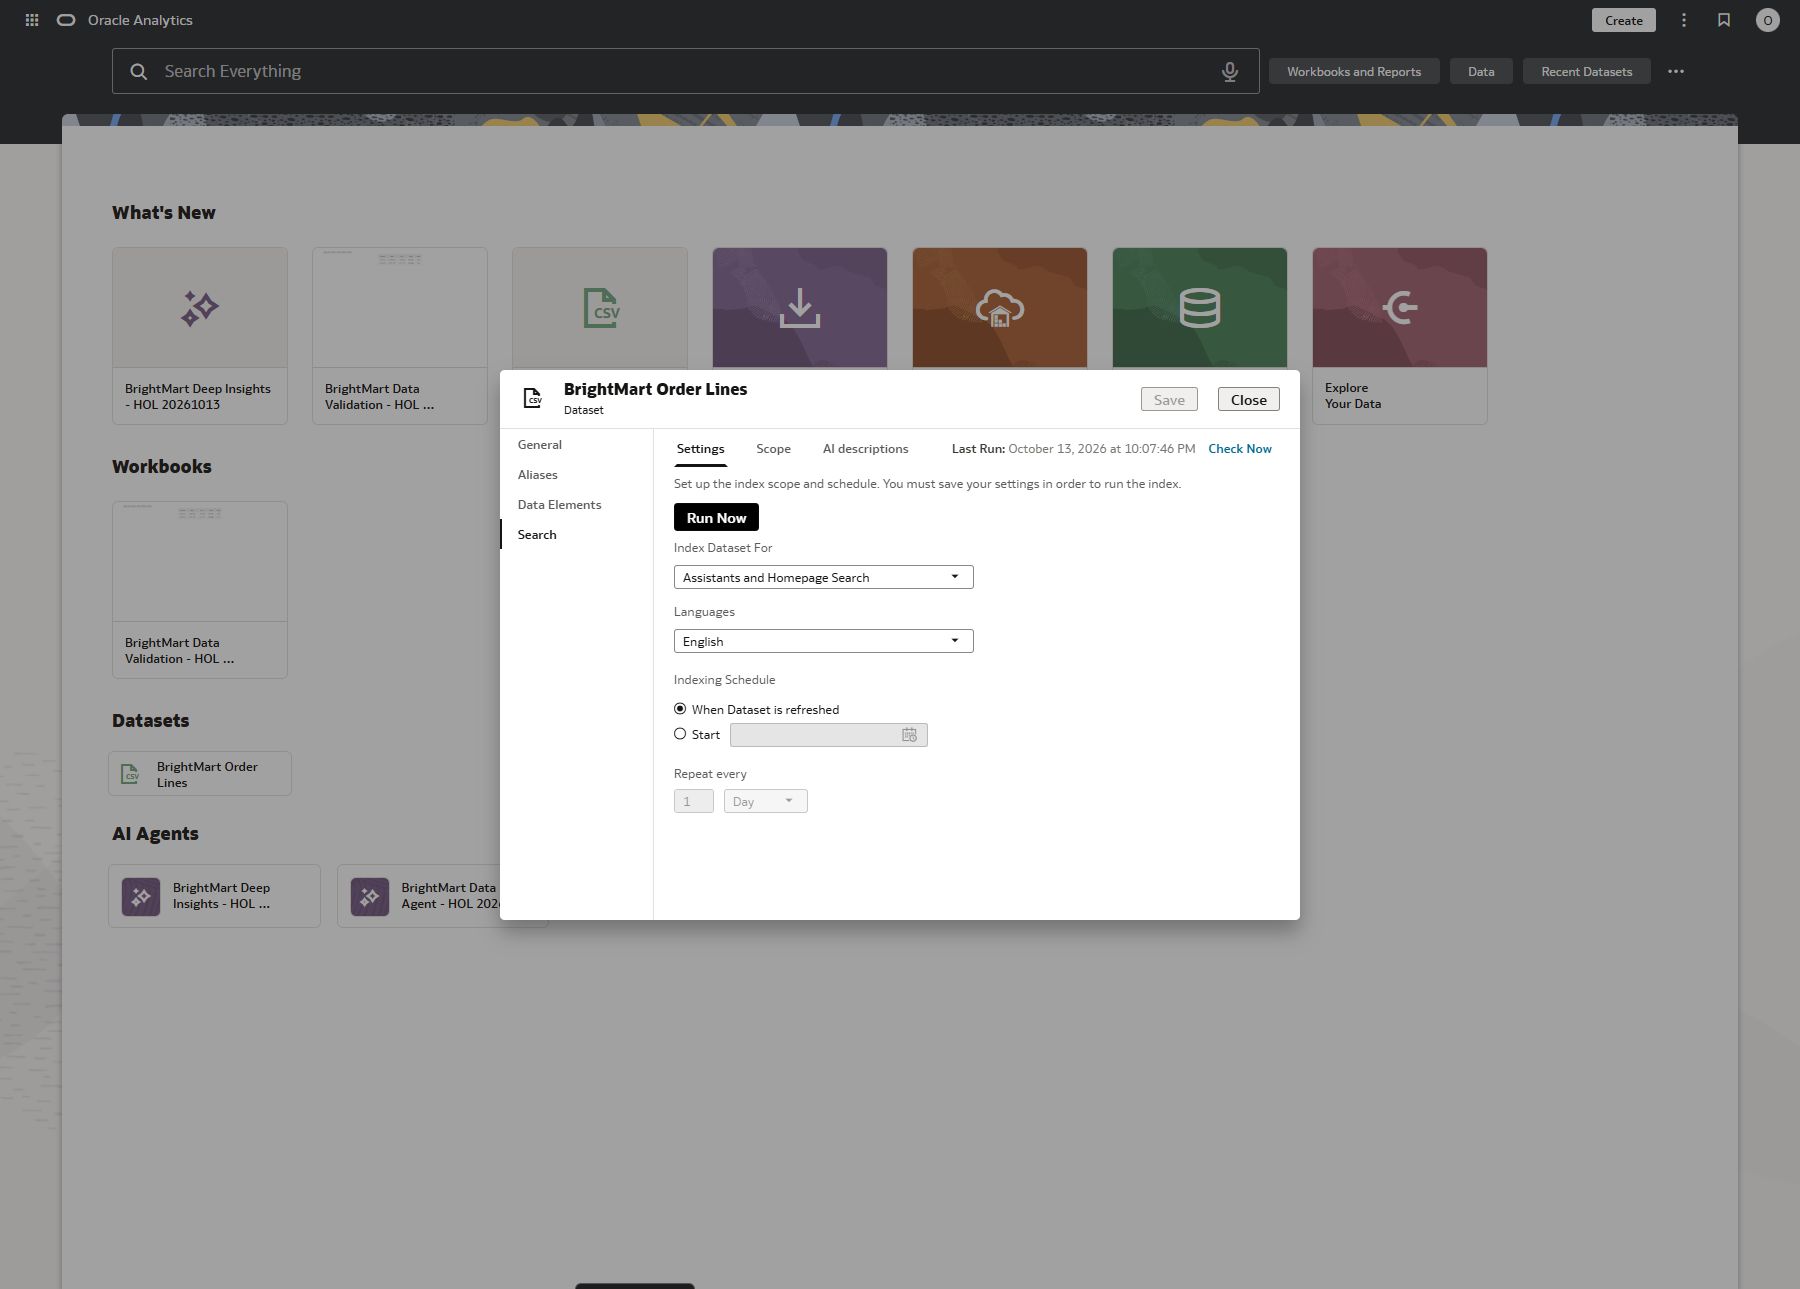
Configure indexing for the dataset
Navigation path
Home or Data page → BrightMart Order Lines → Actions → Inspect → Search → Settings
How to configure it: To index this dataset, open BrightMart Order Lines, choose Actions → Inspect, then open Search → Settings. Set Index Dataset For to Assistants and Homepage Search, select English, save, and run the index. This screen shows the completed setting.
Why this step matters: Indexing makes the selected dataset fields and values available for assistant search. A Deep Insights Agent still needs its source to be prepared; agent creation does not perform indexing for you.
Check in the screenshot: Confirm that Index Dataset For shows Assistants and Homepage Search. That controls where the indexed dataset can be found; it does not select the agent type.
PRECONFIGURED · CONFIGURATION GUIDE 03
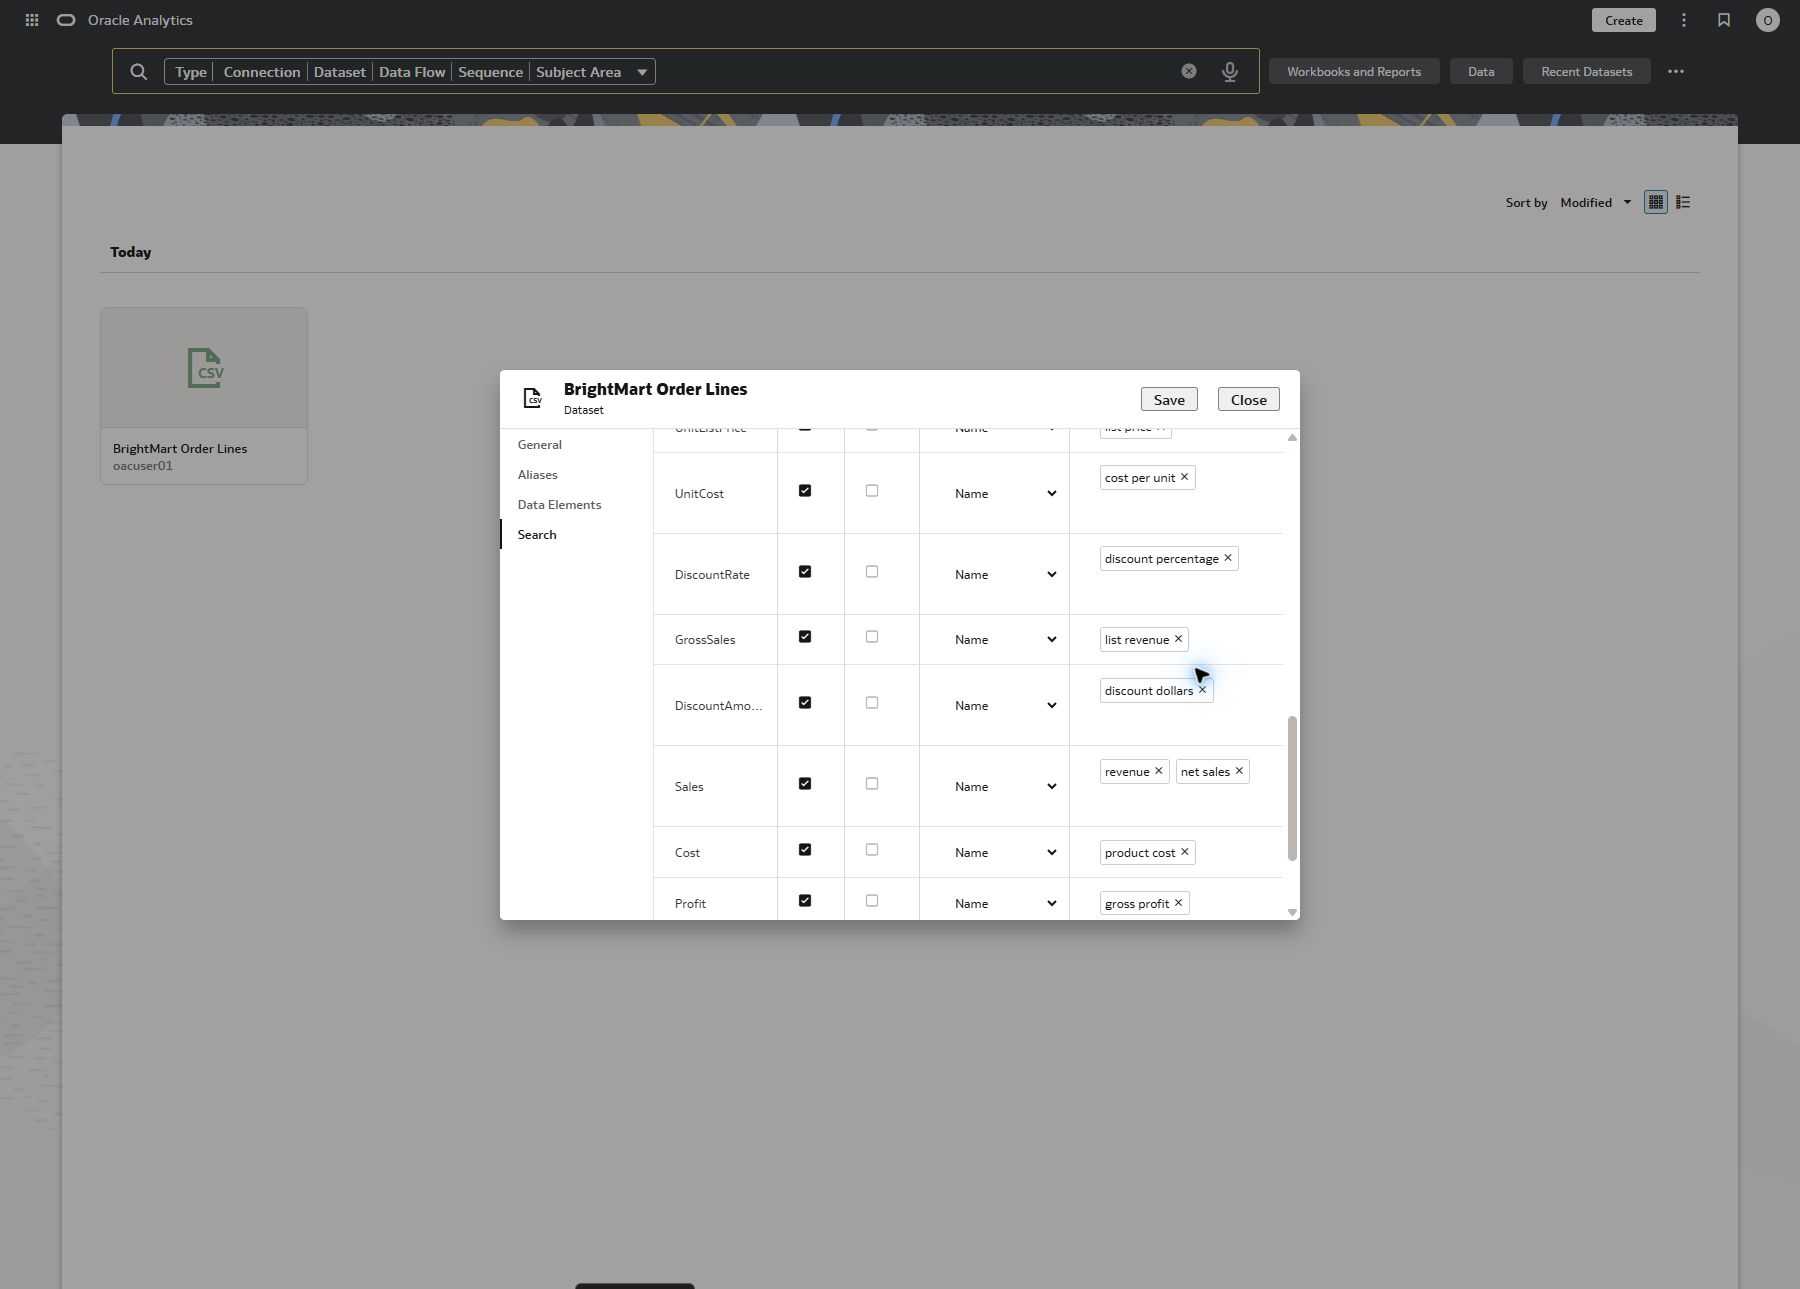
Select index scope and add synonyms
Navigation path
BrightMart Order Lines → Actions → Inspect → Search → Scope
How to configure it: To refine the dataset index, open Scope. Keep useful searchable fields and business values in scope. Add revenue and net sales for Sales, product cost for Cost, gross profit for Profit, and discount percentage for DiscountRate.
Why this step matters: People may use a business term that differs from a column name. Synonyms help match the term to the correct field; indexed values help resolve filters such as a category or quarter.
Check in the screenshot: Find the Sales synonyms in the screenshot. Avoid indexing every unique identifier value unless there is a real search need.
PRECONFIGURED · CONFIGURATION GUIDE 04
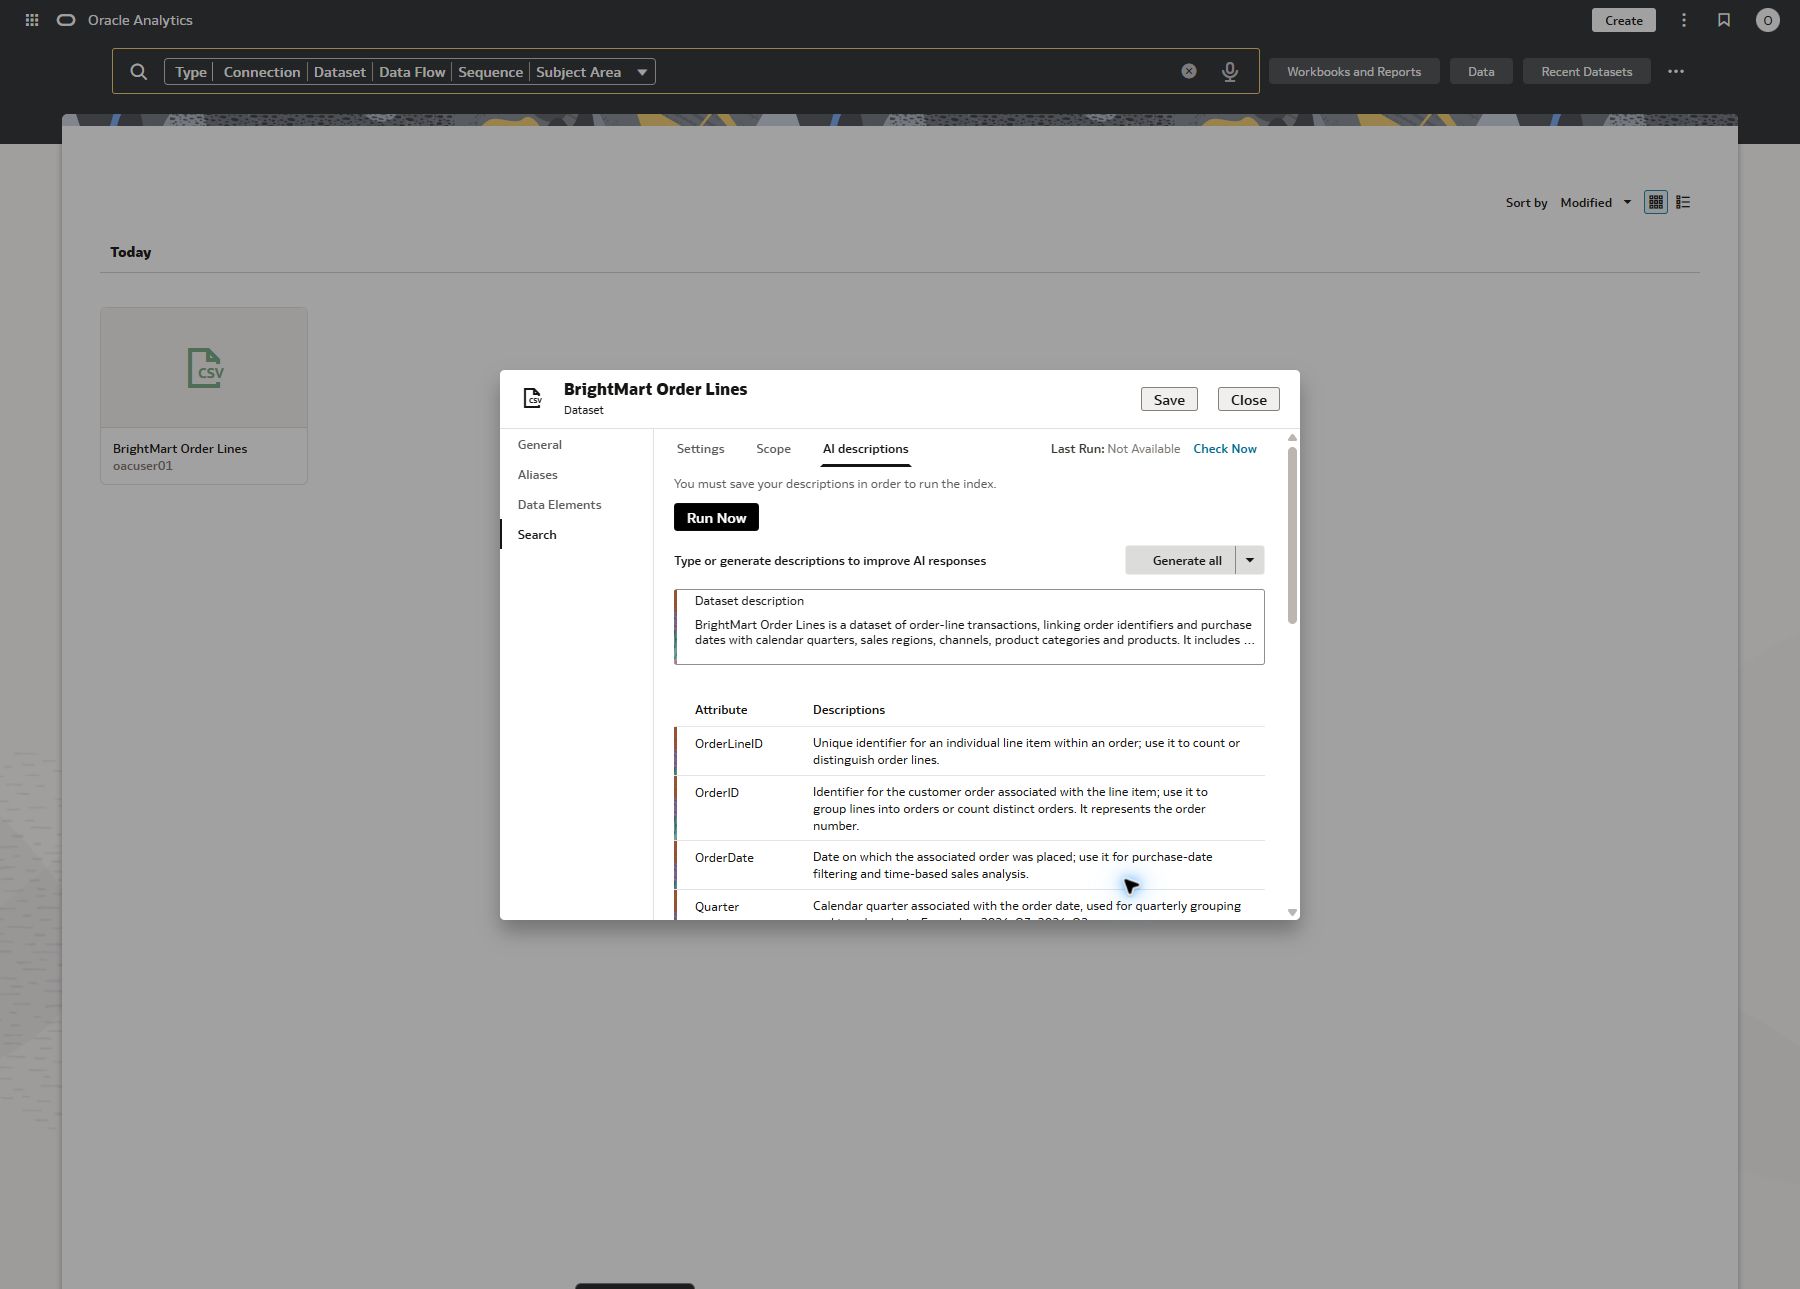
Generate AI Description drafts
Navigation path
BrightMart Order Lines → Actions → Inspect → Search → AI Descriptions → Generate all
How to configure it: To create initial descriptions, open AI Descriptions and select Generate all. Review the generated dataset and column text as a draft before accepting it.
Why this step matters: Column names alone do not explain grain, units, formulas or whether a field can be summed. A draft saves typing but does not know all BrightMart business rules.
Check in the screenshot: Find the Generate all control and the generated dataset/column text in the screenshot.
PRECONFIGURED · CONFIGURATION GUIDE 05
Correct and enrich the descriptions
Navigation path
BrightMart Order Lines → Actions → Inspect → Search → AI Descriptions → edit text → Save
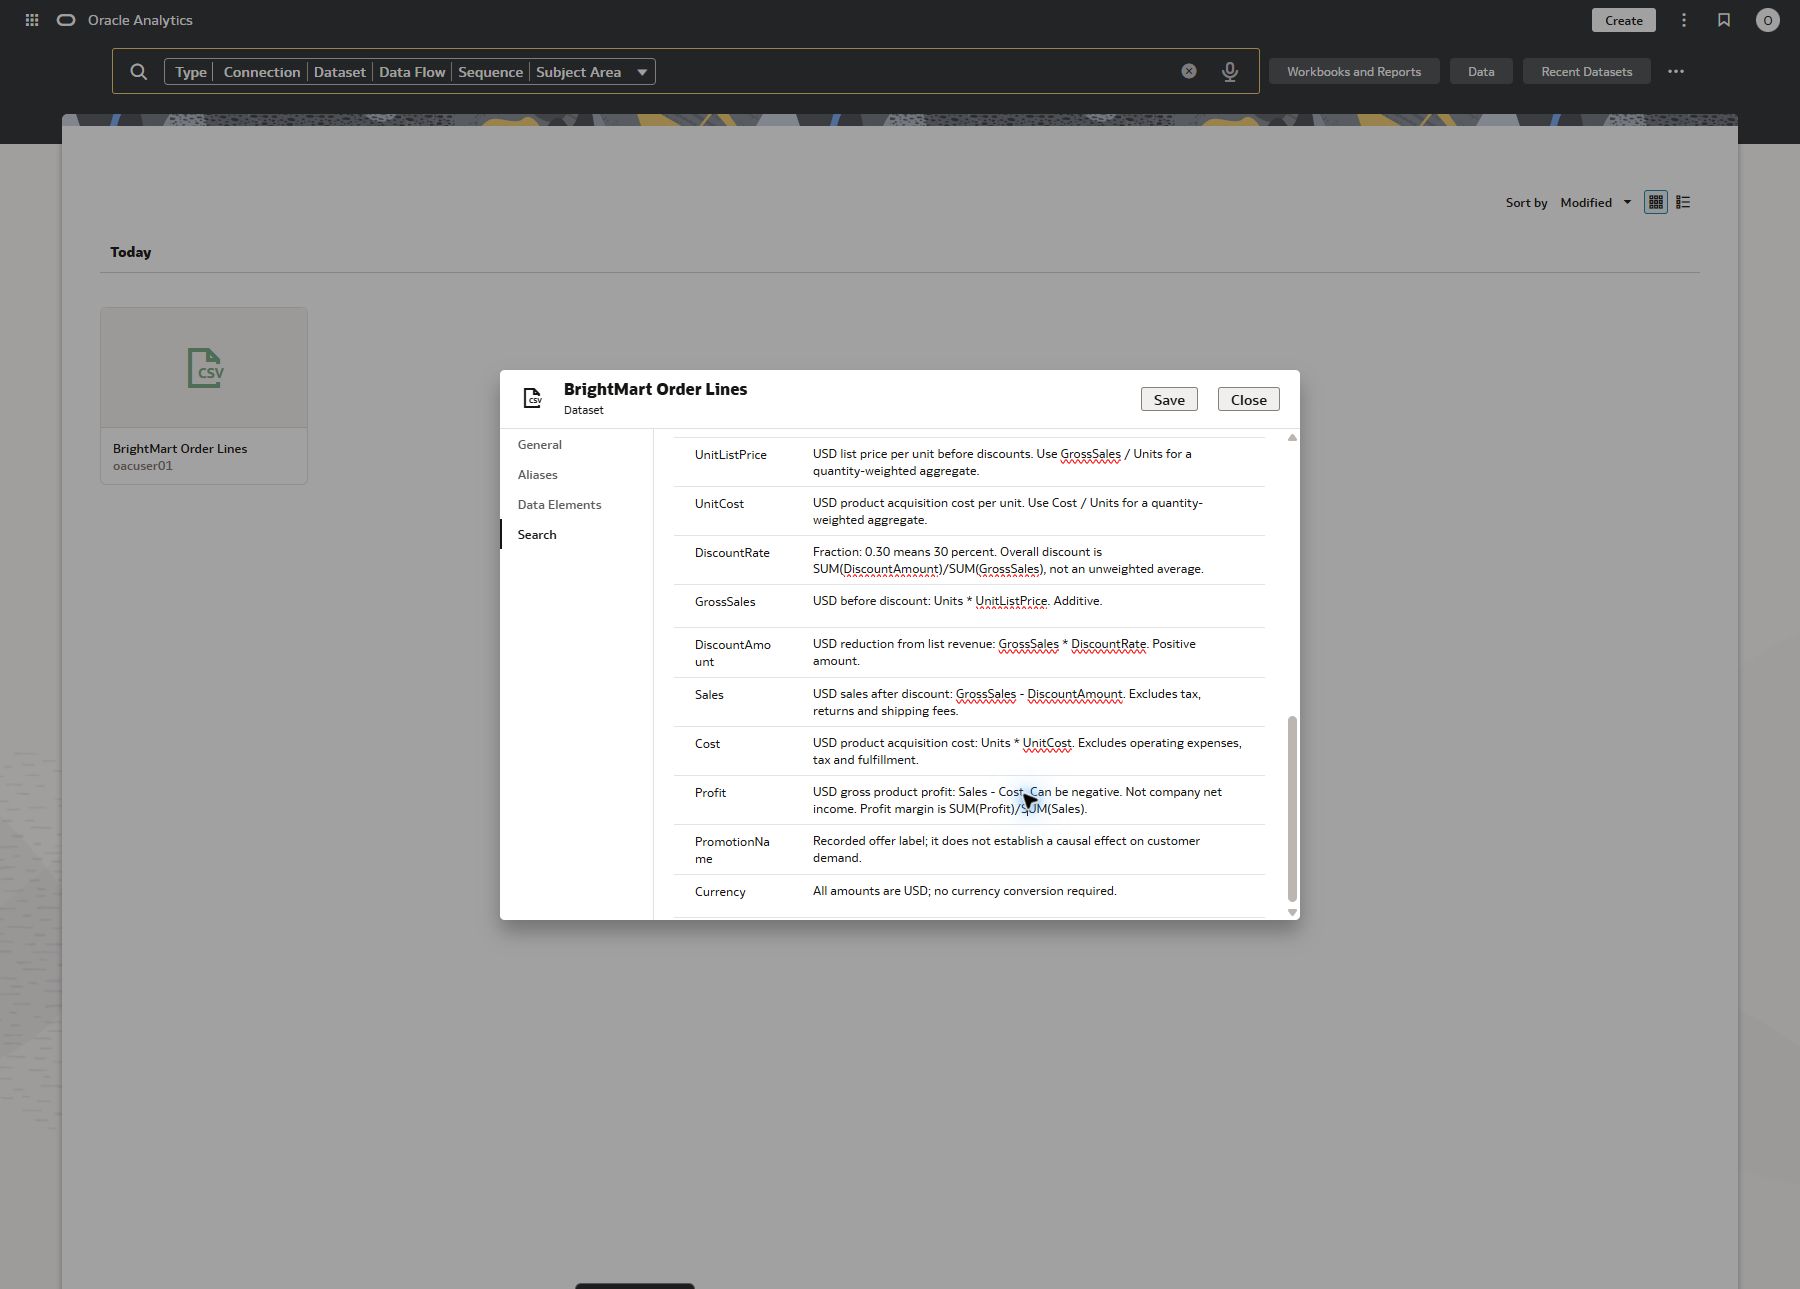
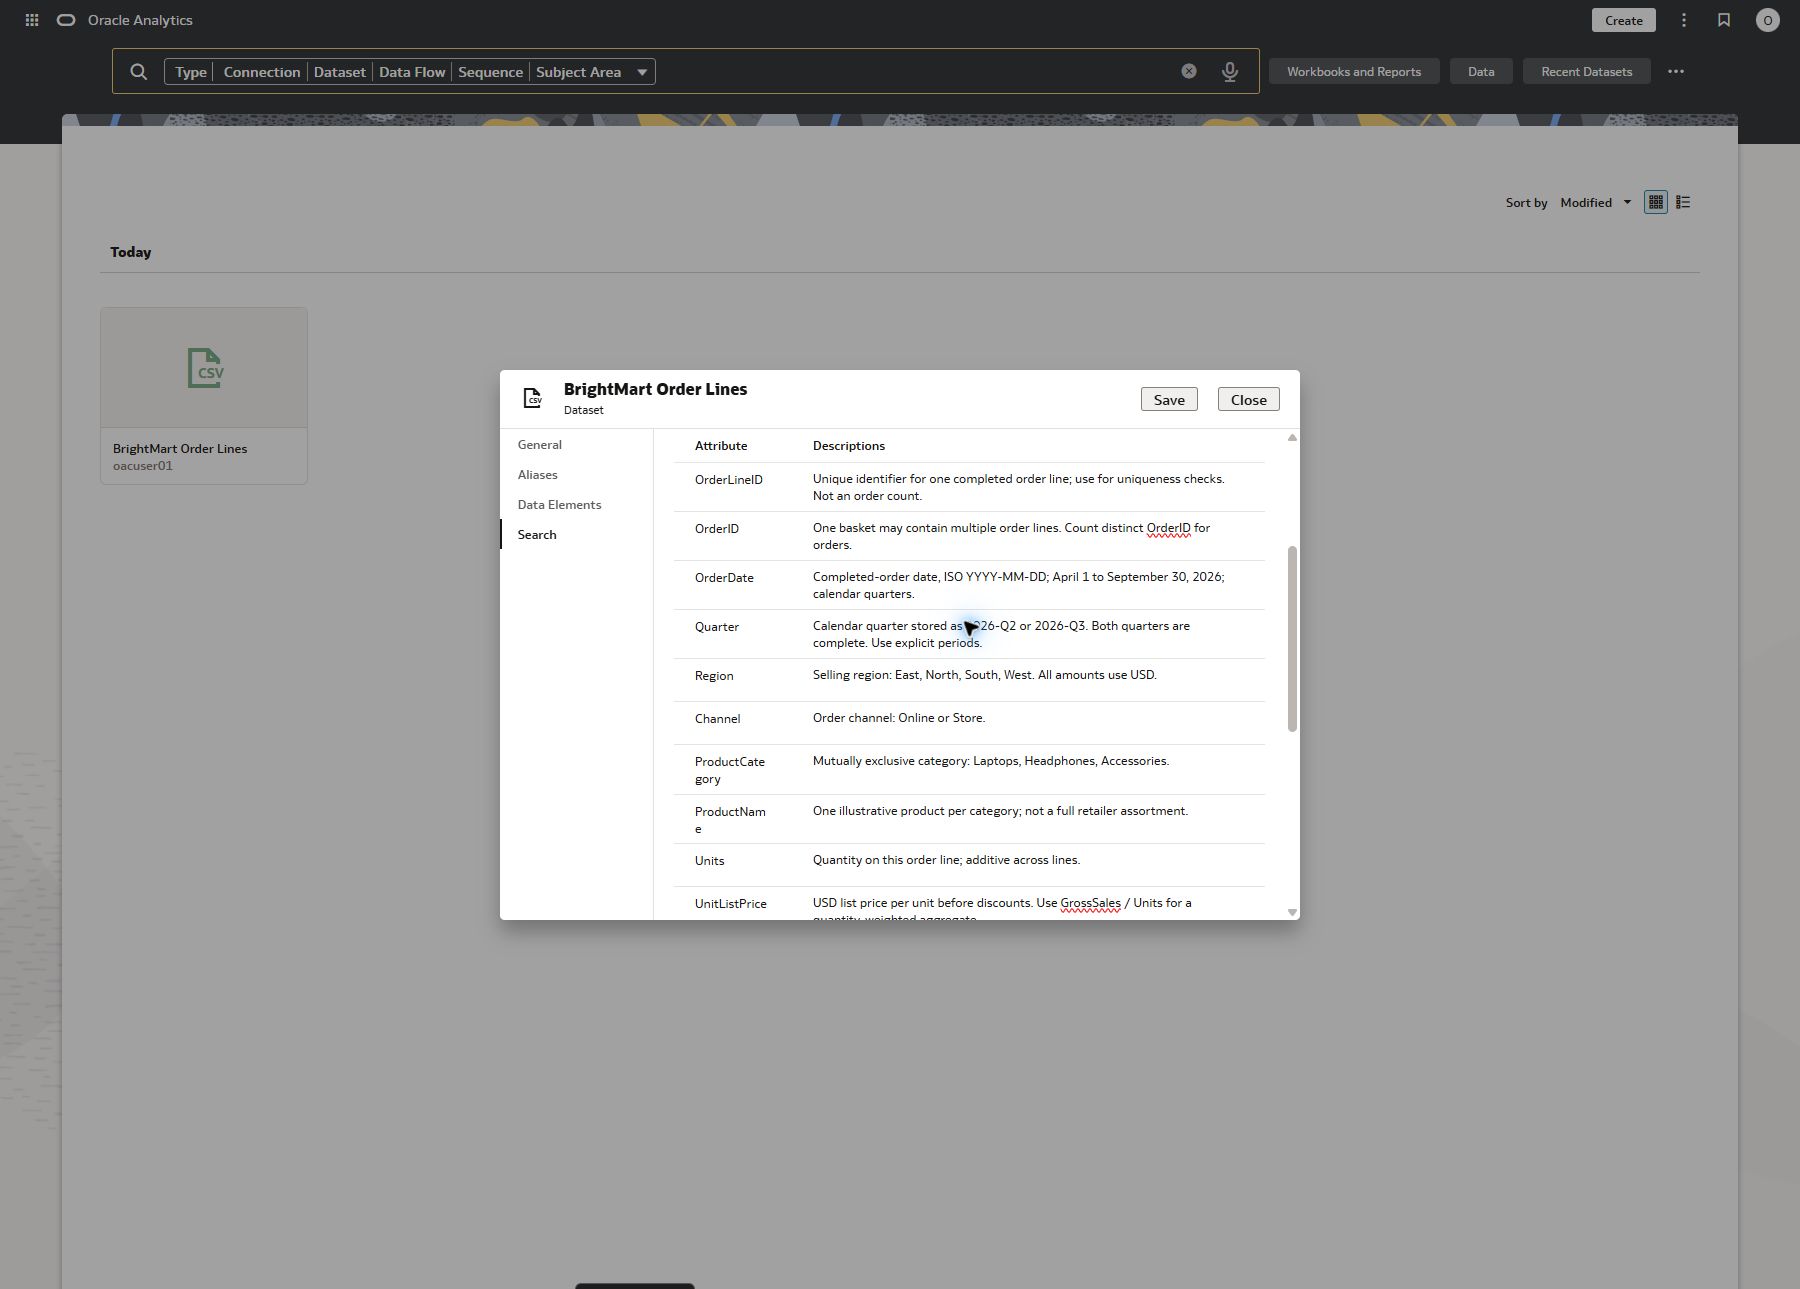
How to configure it: To improve a generated description, edit its text and save it. Clarify that Profit means gross product Profit (Sales − Cost), not company net income; 0.30 means 30% discount; overall discount is SUM(DiscountAmount)/SUM(GrossSales). Describe UnitCost and UnitListPrice as per-unit attributes. State that each row is one completed order line.
Why this step matters: The agent uses these definitions when it selects measures, applies aggregation and explains results. Generated descriptions can be corrected or extended whenever the business definition needs more detail.
Check in the screenshot: Read the Profit, DiscountRate and dataset-grain descriptions shown in the two screenshots.
PRECONFIGURED · CONFIGURATION GUIDE 06
Save and run the index
Navigation path
BrightMart Order Lines → Actions → Inspect → Search → Save → Run Now → Check Now
How to configure it: To publish the prepared dataset index, save the search settings, synonyms and descriptions. Select Run Now, then Check Now to confirm a Last Run value. Re-run after later metadata changes.
Why this step matters: Edits in the dialog do not automatically prove that the searchable index contains the latest definitions. The Last Run indicator provides a readiness check.
Check in the screenshot: The final screen shows the saved combined index setting and a Last Run timestamp. A simple agent question then checks actual discoverability.
PRECONFIGURED · CONFIGURATION GUIDE 07
Create the Deep Insights agent
Navigation path
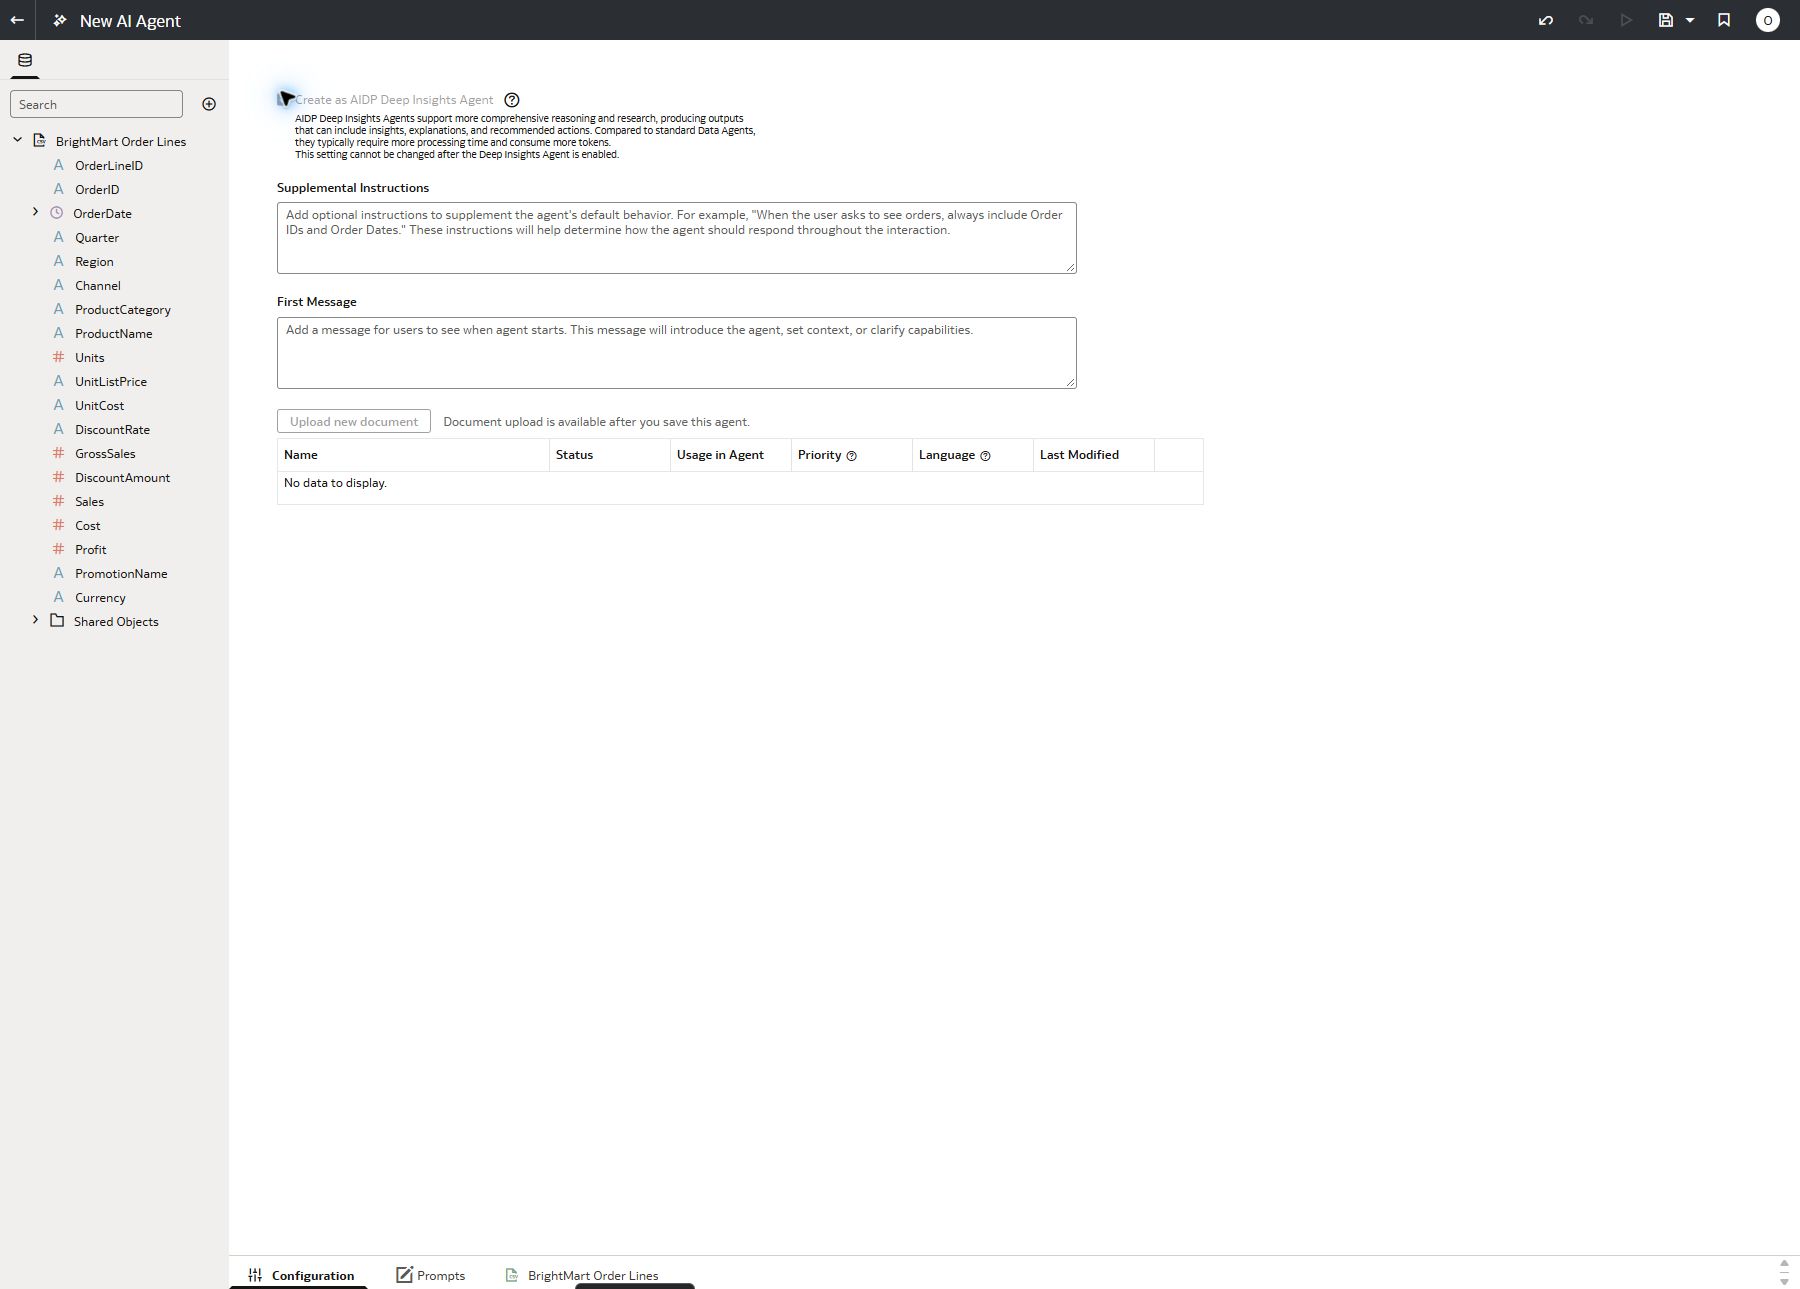
Home → Create → AI Agent → select BrightMart Order Lines → Create as AIDP Deep Insights Agent
How to configure it: Attach the indexed Order Lines source and select the AIDP Deep Insights Agent option before saving the prepared agent. A separate standard Data Agent uses the same source for comparison.
Why this step matters: This setting changes the agent type and makes the broader investigative workflow available. It does not change the underlying sales arithmetic.
Check in the screenshot: Point to the selected DI control and the attached source on the left of the screenshot.
PRECONFIGURED · CONFIGURATION GUIDE 08
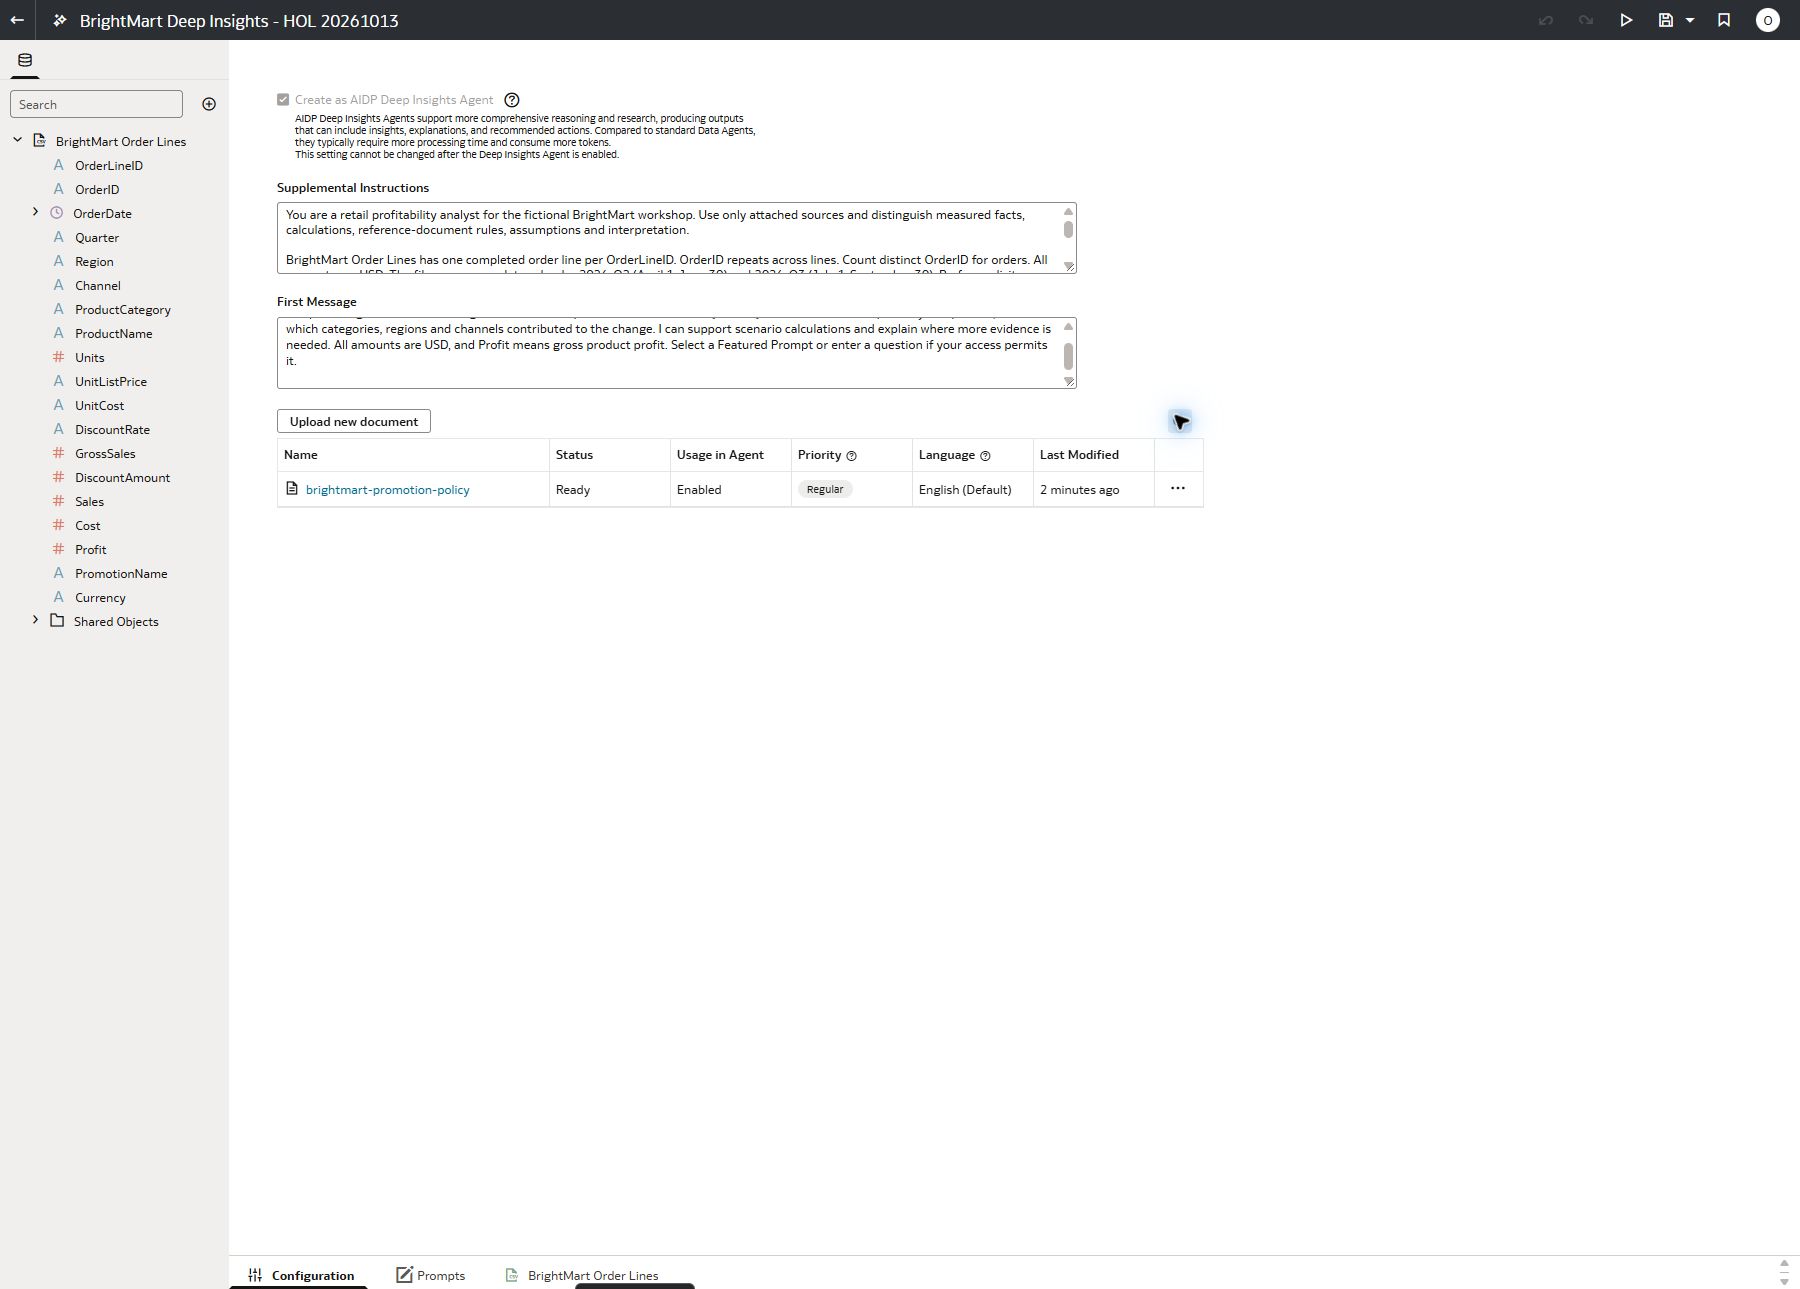
Add guidance and a first message
Navigation path
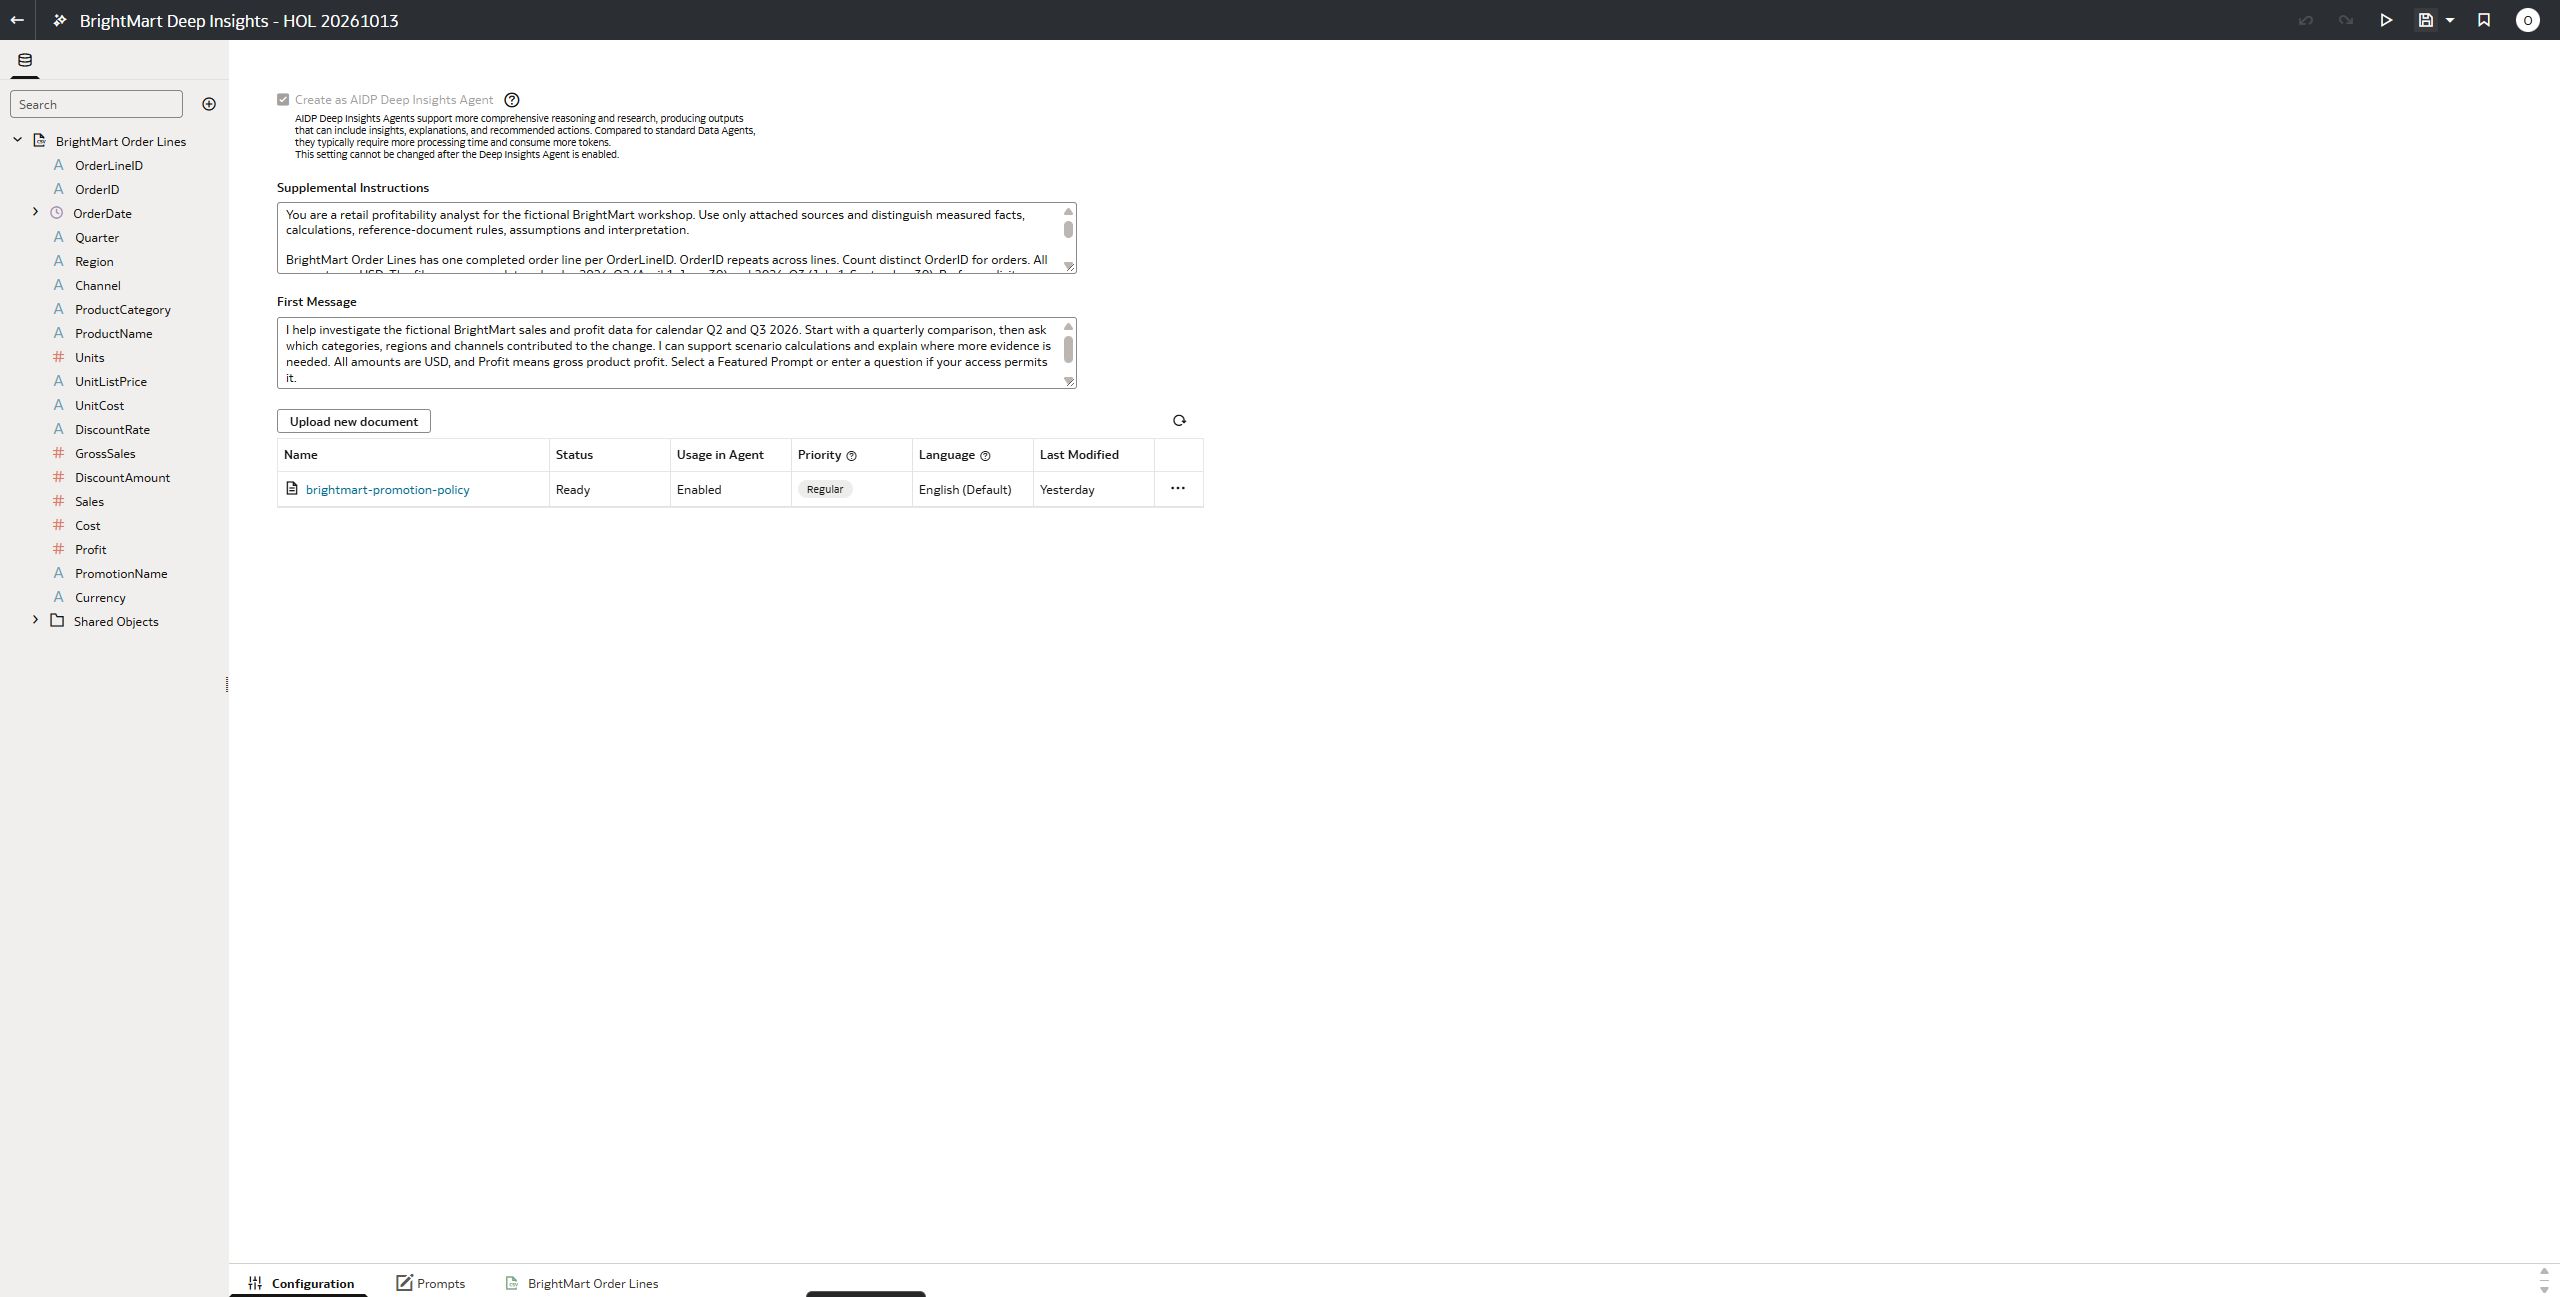
Prepared DI Agent → Configuration → Supplemental Instructions and First Message
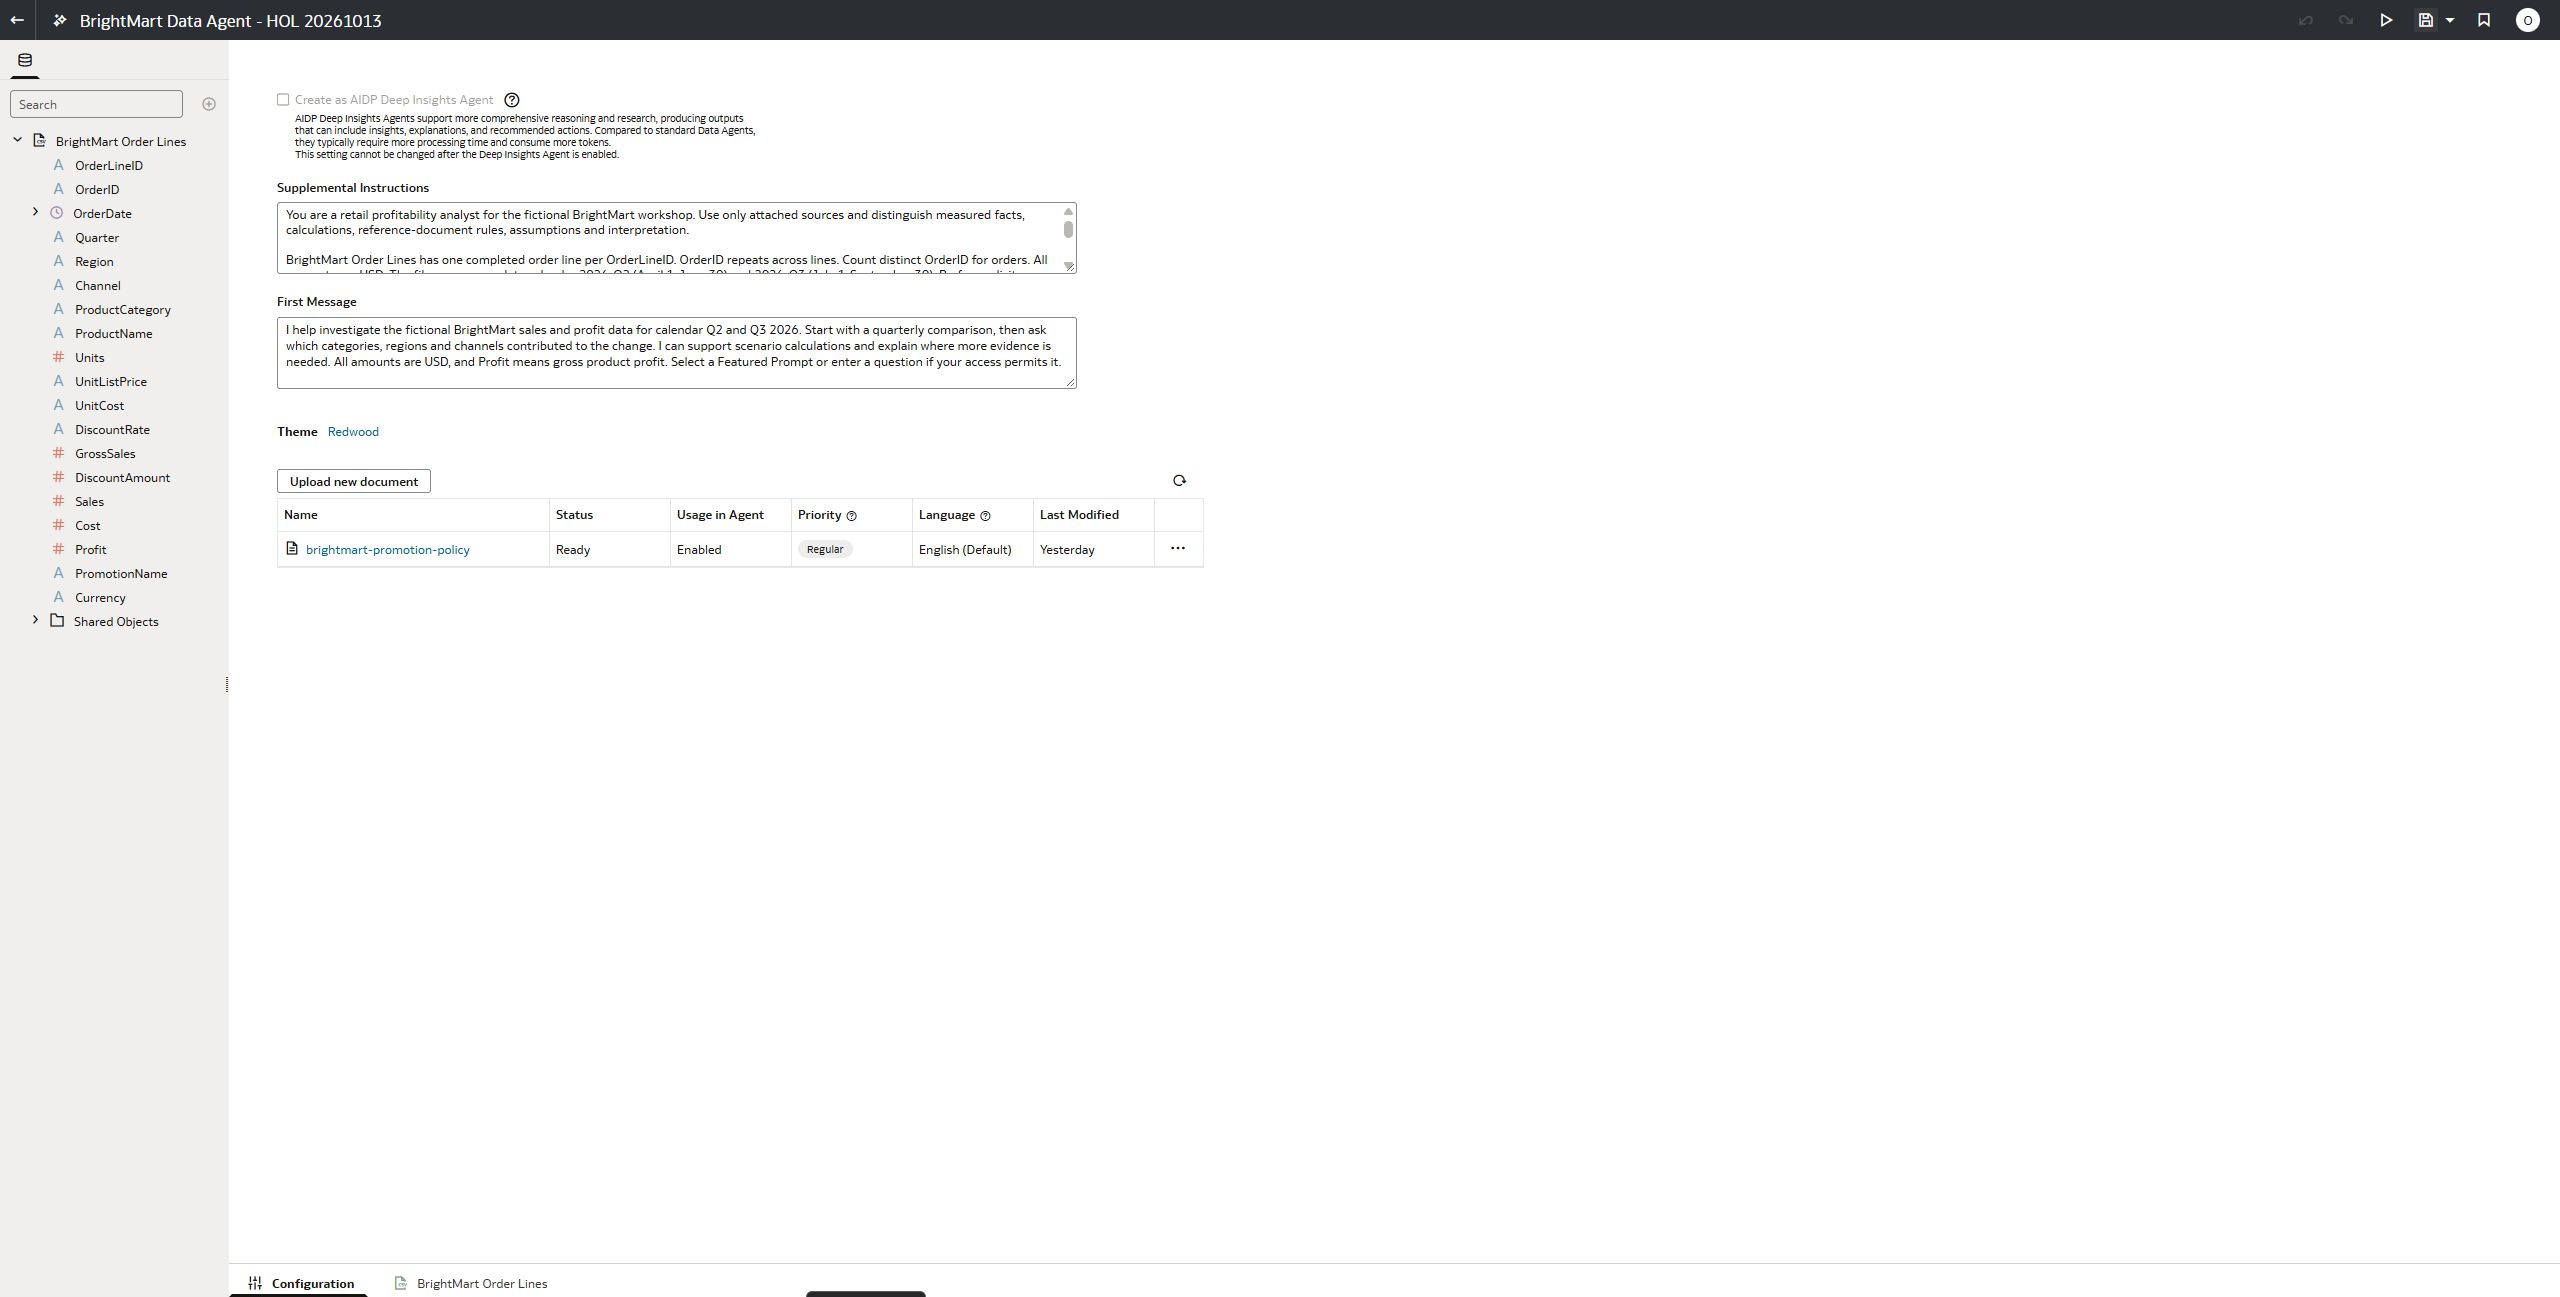
How to configure it: Enter the BrightMart business rules in Supplemental Instructions. Use First Message to tell participants the scope: Q2/Q3, USD, gross product Profit, and available questions.
Why this step matters: Instructions guide how the agent interprets the sources; the First Message orients the user when the chat opens. Neither creates missing facts or overrides source security.
Check in the screenshot: The saved configuration screen shows both text fields populated. Generated AI Descriptions remain editable at dataset level.
PRECONFIGURED · CONFIGURATION GUIDE 09
Attach policy knowledge
Navigation path
Prepared DI Agent → Configuration → Upload new document → verify Ready
How to configure it: Attach the BrightMart Promotion Policy document and wait until its status is Ready and Usage in Agent is Enabled. The Data Agent has the same policy for a fair comparison.
Why this step matters: Retrieval augmented generation (RAG) supplies the approval-threshold rule from a document; the order-line dataset supplies discount and Profit figures.
Check in the screenshot: Point to Ready and Enabled. A policy rule identifies an approval review; it is not an approval record.
PRECONFIGURED · CONFIGURATION GUIDE 10
Prepare and attach regional targets
Navigation path
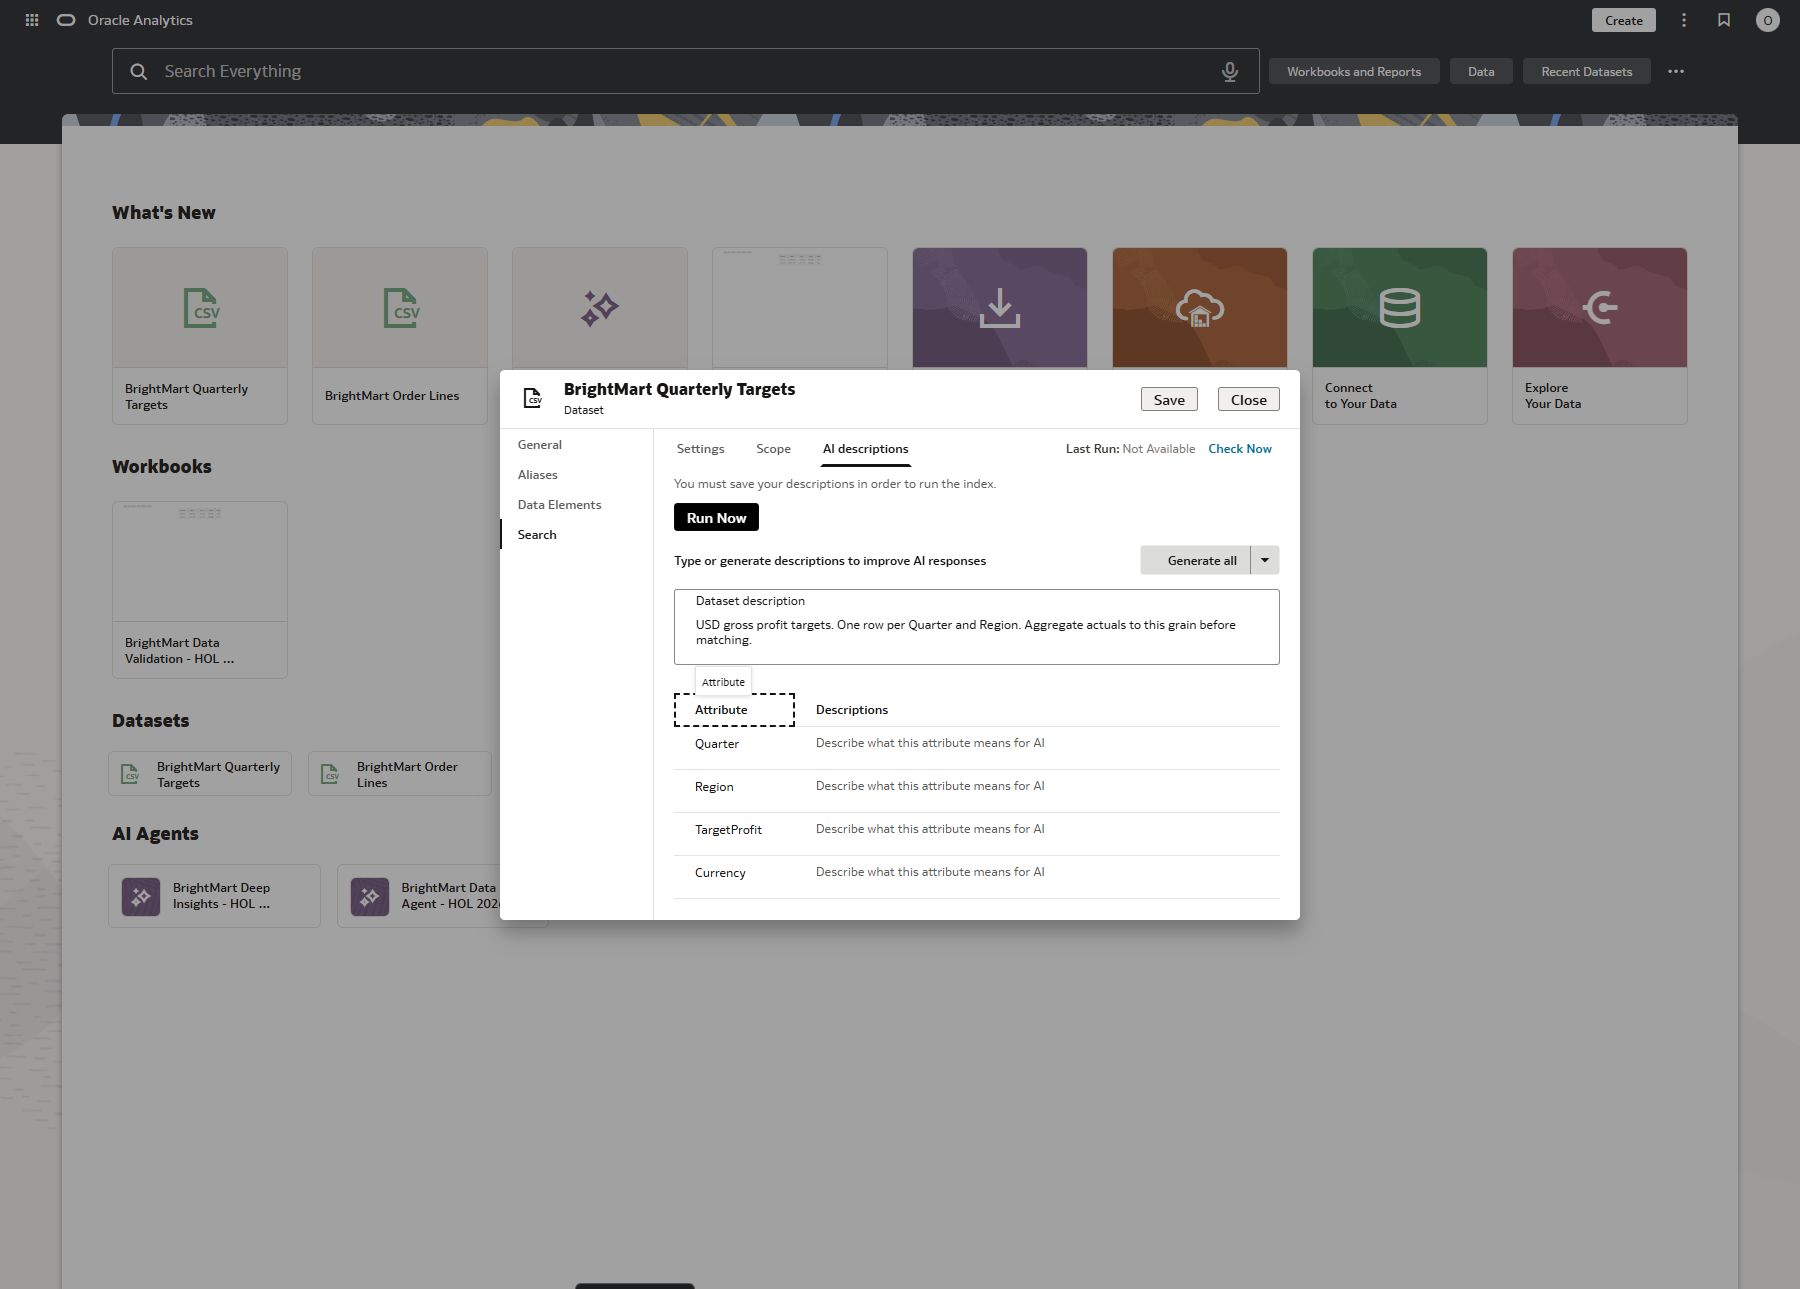
BrightMart Quarterly Targets → Inspect → Search → AI descriptions and index; then DI Agent → add source
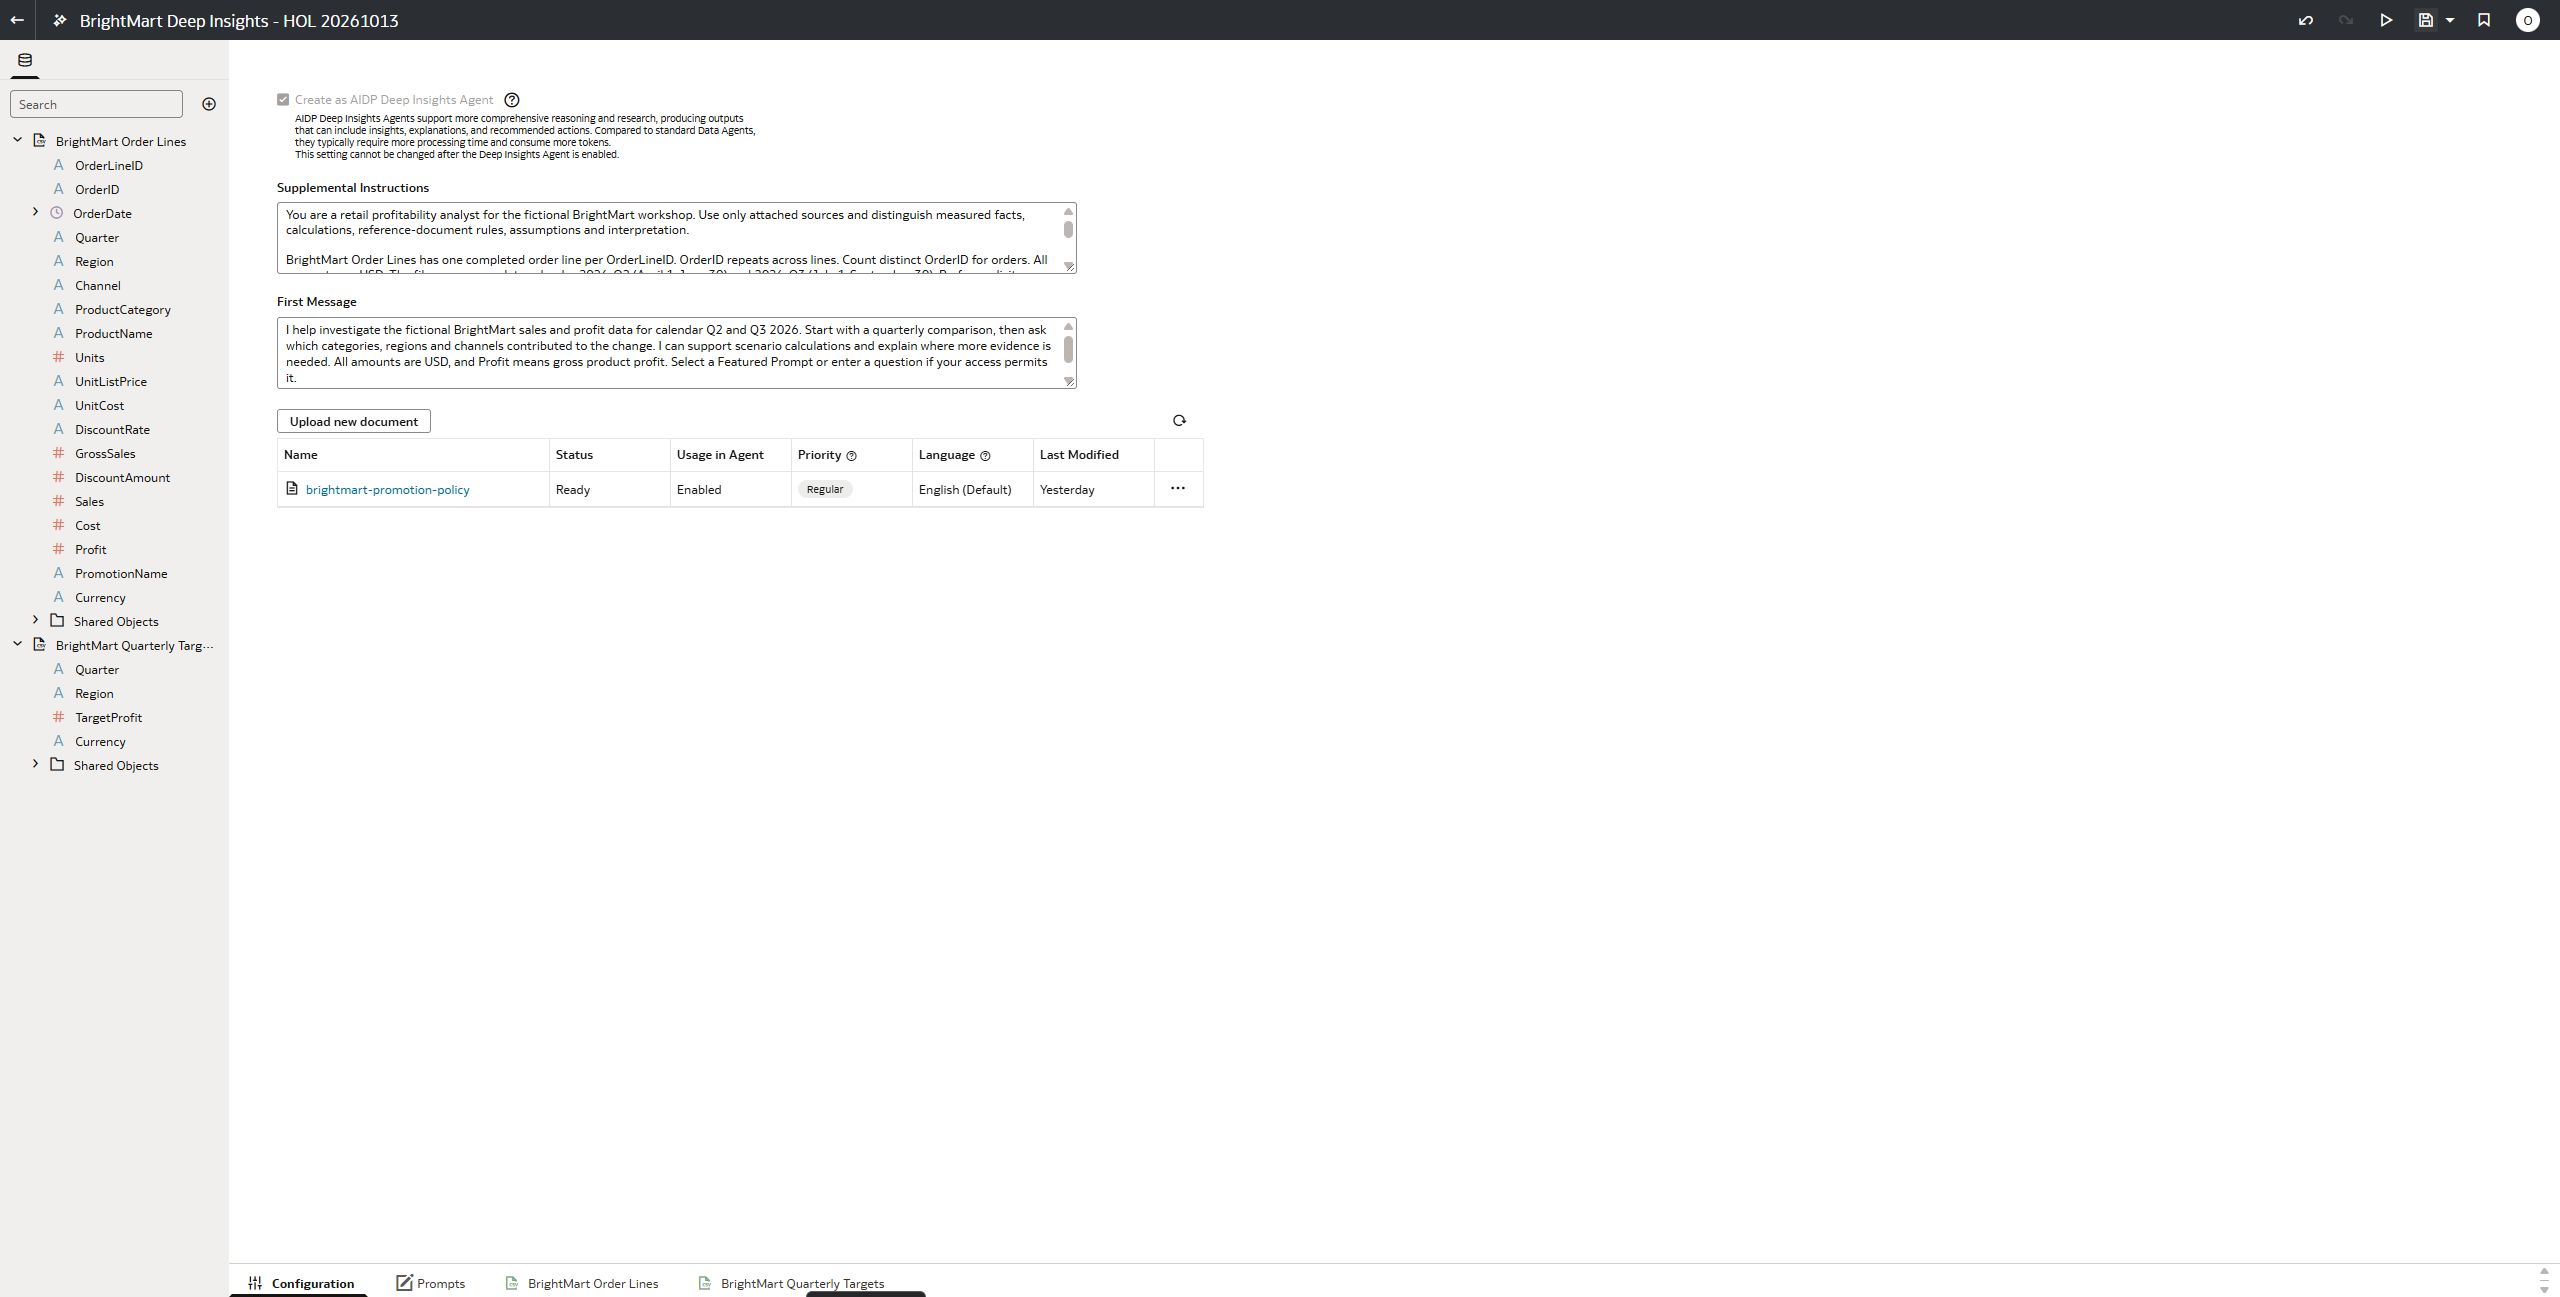
How to configure it: Describe TargetProfit as a USD gross product Profit target with one row per Quarter and Region. Save, index, and attach Quarterly Targets as a second DI source.
Why this step matters: The target dataset has a different row grain from order lines. Aggregate actual Profit to Quarter × Region before matching, or the target could be repeated across orders.
Check in the screenshot: The target description states its grain, and the DI source list shows both prepared datasets.
Key distinction to say aloud
“The index and synonyms make the facts discoverable. AI Descriptions give the data its business meaning. Agent instructions guide response behavior. The policy supplies a rule. Deep Insights plans and executes the analytical steps at runtime; we still verify the final figures.”
Source guidance: Oracle dataset indexing · Oracle AI Descriptions · Oracle AI Agent setup · Oracle agent access · Philippe and Lalitha's DI overview.
Open the existing agent →PARTICIPANTS START HERE IN OAC
Open the prepared Deep Insights Agent
Use the existing agent. The screenshots show its observed aiw2 names; your instructor may provide assigned copies.
1
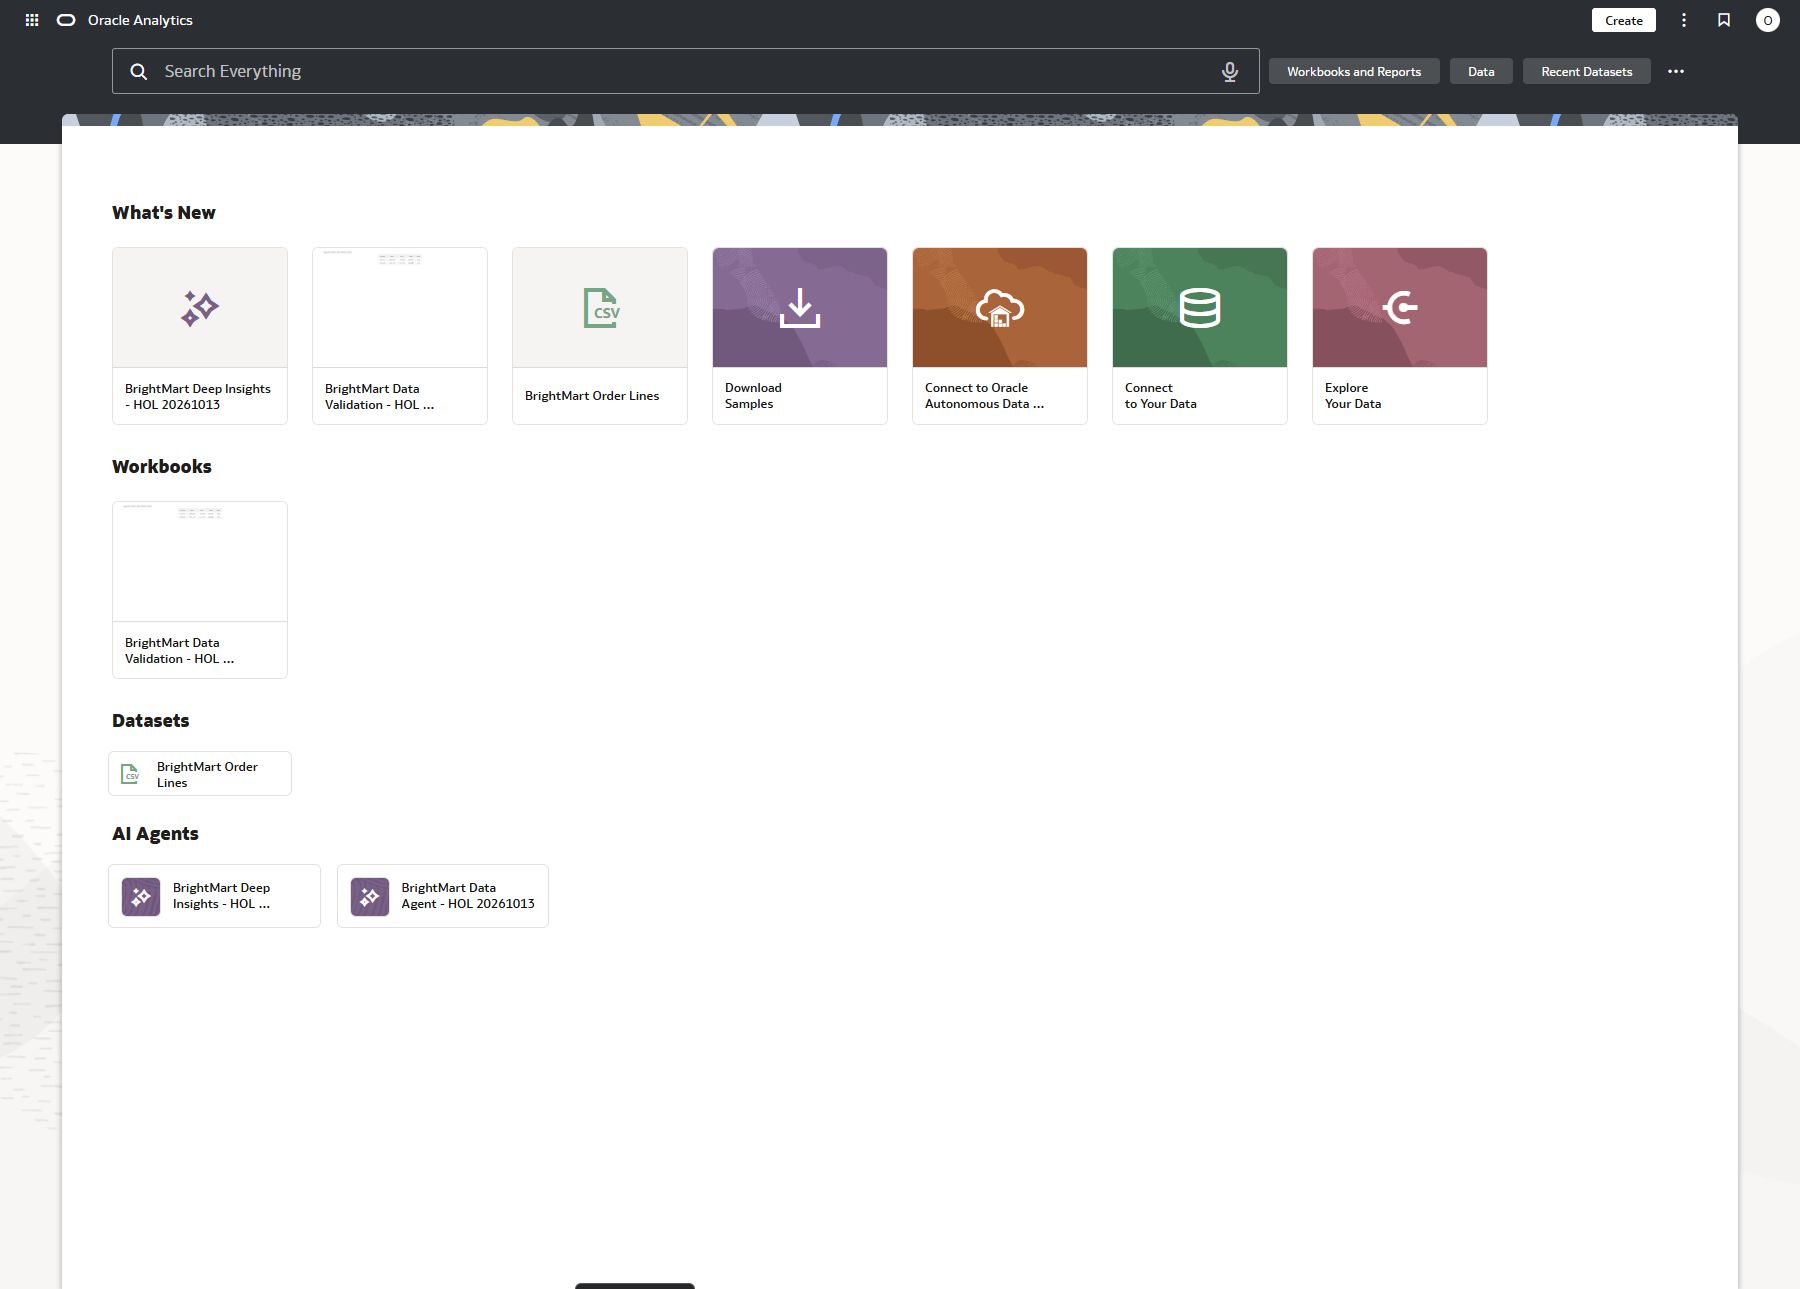
Open your assigned Oracle Analytics Cloud (OAC) training instance and go to Home → AI Agents. Look for BrightMart Deep Insights - HOL 20261013.
2
Open that tile. Read the First Message: the agent will analyze 2026-Q2 and Q3 retail Profit using prepared sources. Select New chat before each case.
3
Use the menu beside the prompt box to select Instant for Case 1 and Research for Cases 2–5. For the validated research comparison, select openai.gpt-5.6-sol and Low reasoning if those controls are offered.
4
For comparison cases, open BrightMart Data Agent - HOL 20261013 from the Home AI Agents list. Both agents use the prepared Order Lines and policy.
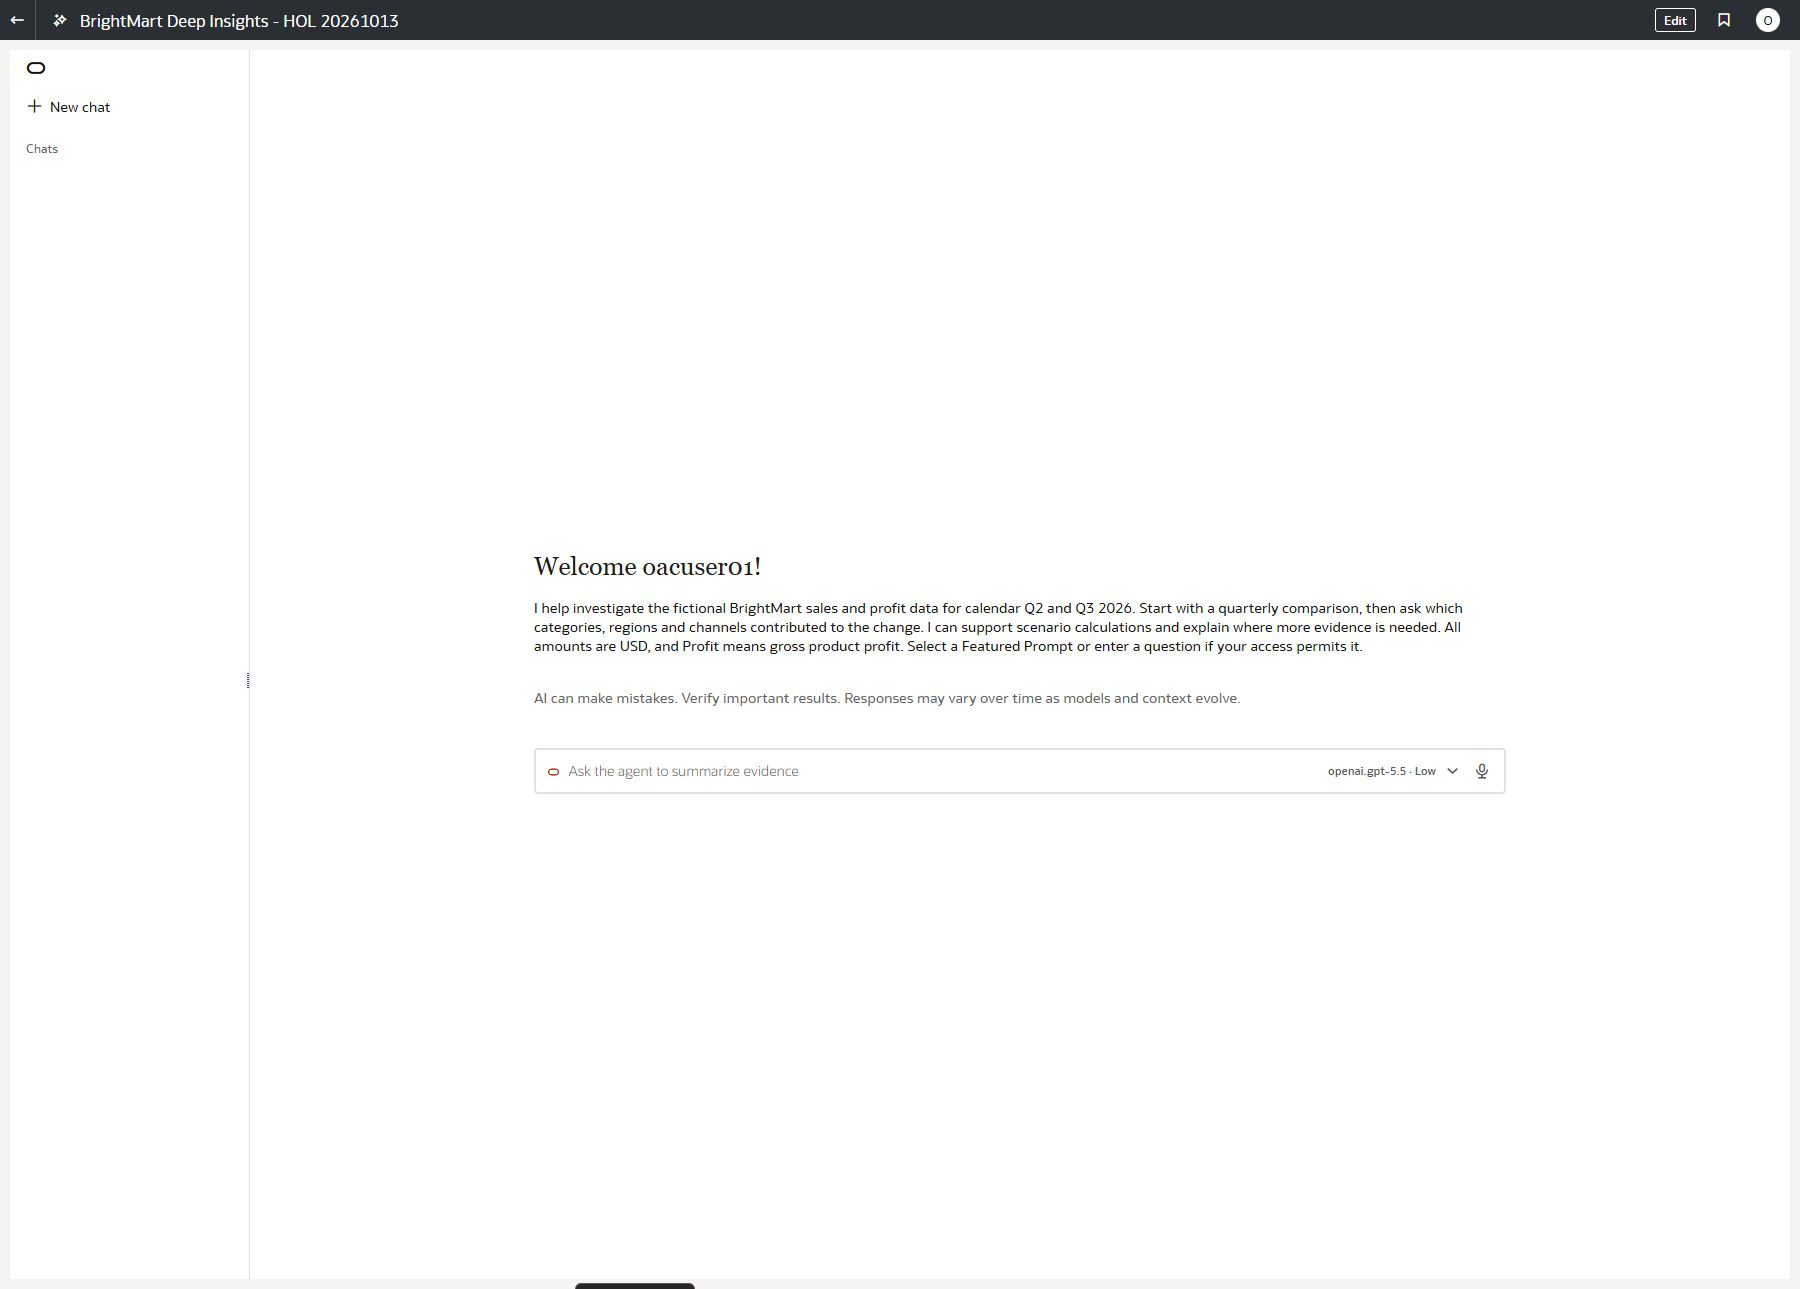
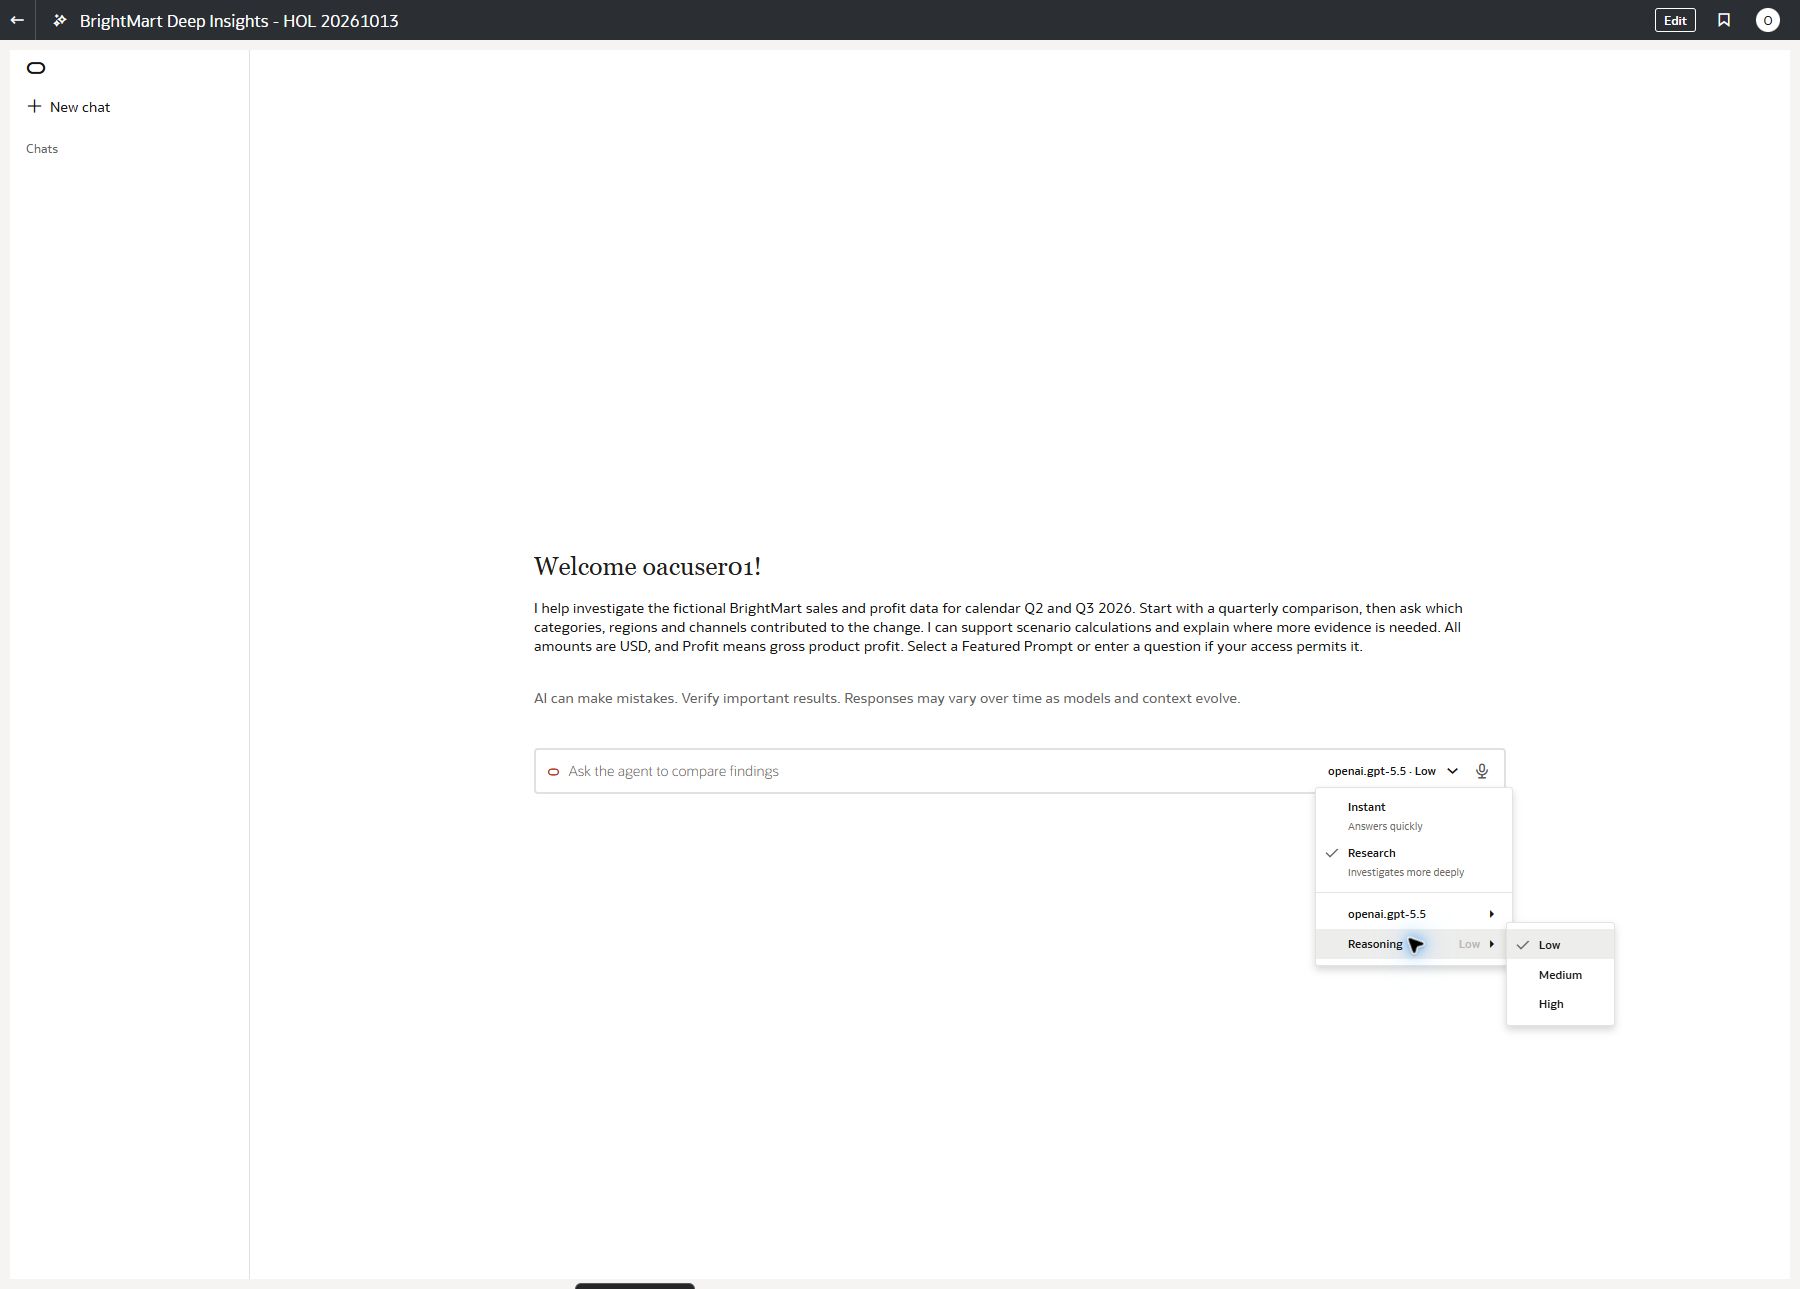
Control meaning: Instant and Research are interaction modes; the model selection and reasoning level are separate choices. A particular mode does not guarantee Python use or a correct answer. Inspect the tool trace after each run.
Begin Case 1 →CASE 1 OF 5 · Data Agent + DI Instant · 5 min
Establish what changed
Ask the same totals question in the prepared Data Agent and DI Instant. Verify that their shared governed source produces matching figures.
Business questionRun the identical question in both agents. Compare the figures before asking for a diagnosis.
ASK THE PREPARED AGENT5 min
TESTED PROMPT
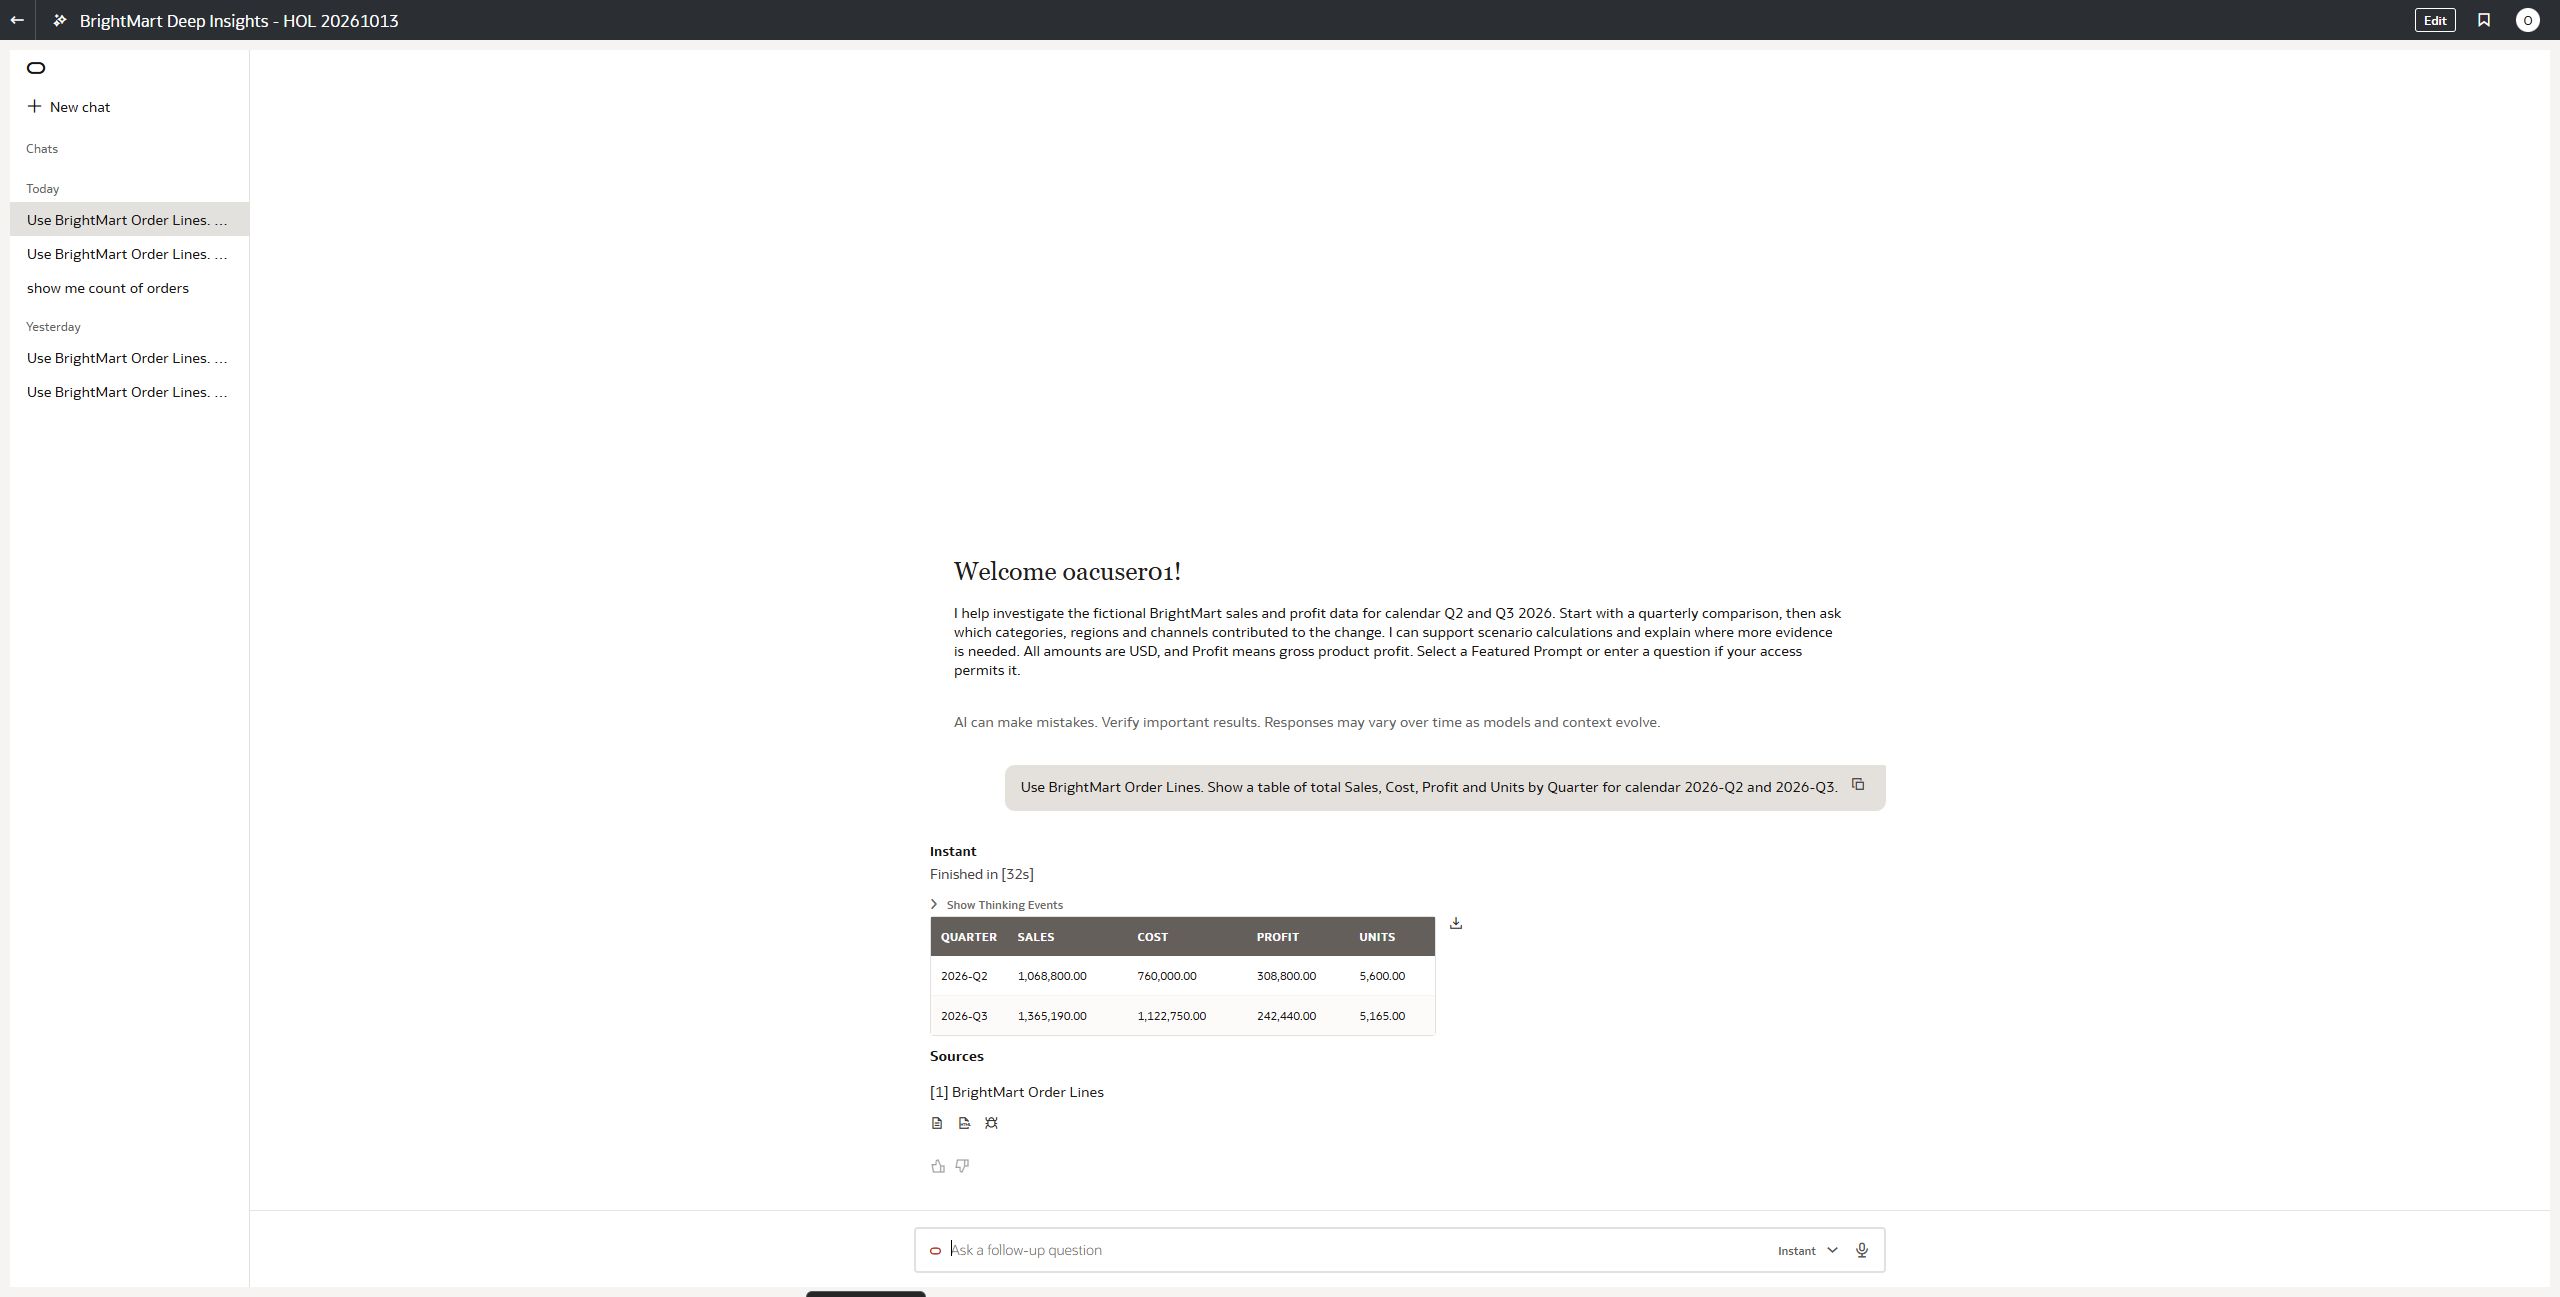
Use BrightMart Order Lines. Show a table of total Sales, Cost, Profit and Units by Quarter for calendar 2026-Q2 and 2026-Q3.
Before you run: predict the agent's route
Would a direct governed query be enough for this question? Compare both answers before moving on.
DEEP INSIGHTS FEATURE TO OBSERVEGoverned baseline
A direct totals request is a useful control: both agents should return the same measures from the same indexed source.
WHAT WE OBSERVED ON AIW2
Both agents returned the same quarterly table: Q2 Sales $1,068,800 and Profit $308,800; Q3 Sales $1,365,190 and Profit $242,440. Sales rose $296,390 while Profit fell $66,360.
WHAT TO LOOK FOR
Both agents can answer the direct quarterly totals. This establishes a fair baseline; DI is valuable when the next question needs investigation.
Action this result supports: Use the agreed quarterly totals as the baseline and continue to category and segment analysis.
Evidence boundary: The quarterly totals say what changed, not why it changed.
AFTER YOUR AGENT RUN
Compare the observed evidence
Supporting screenshots (1)
CASE 2 OF 5 · Data Agent + DI Research · 8 min
Investigate the profit decline
Ask the same diagnostic prompt in the Data Agent first. Then start a new DI Research chat and ask it again. Compare the responses and open DI's Thinking Events.
Business questionAsk the same broad diagnostic question in both agents. Compare the scope response with DI's sequence of governed category and segment analysis.
ASK THE PREPARED AGENT8 min
TESTED PROMPT · ASK BOTH AGENTS
Use BrightMart Order Lines. Sales increased from calendar 2026-Q2 to 2026-Q3, but Profit decreased. Investigate which ProductCategories contributed most to the Profit change. For the largest declining category, investigate Region and Channel, then compare Units, list prices, discounts, and unit costs. State your analytical approach, show the supporting figures and a structured report, and identify assumptions and missing evidence. Use the data to establish contributors; do not assume that an observed promotion caused changes in customer demand.
WHY THIS QUESTION NEEDS DEEP INSIGHTS
One business question requires several analytical checks
In the recorded BrightMart comparison, the Data Agent answered direct quarterly totals but replied “Your request is beyond the scope of your data” to this broader diagnostic prompt. That is the observed starting point for this lab, not a general rule about Data Agents.
1 Confirm the quarter change2 Rank category contributors3 Inspect the key segment4 Review evidence and report
Deep Insights value: DI carried this prompt through those related steps and assembled a structured diagnosis. Inspect Thinking Events and the supporting figures before using its recommendation.
Before you run: predict the agent's route
What would a direct query answer, and what additional comparisons does the diagnostic request require? Predict the sequence before comparing both agents.
DEEP INSIGHTS FEATURE TO OBSERVEPlan, investigate, recheck
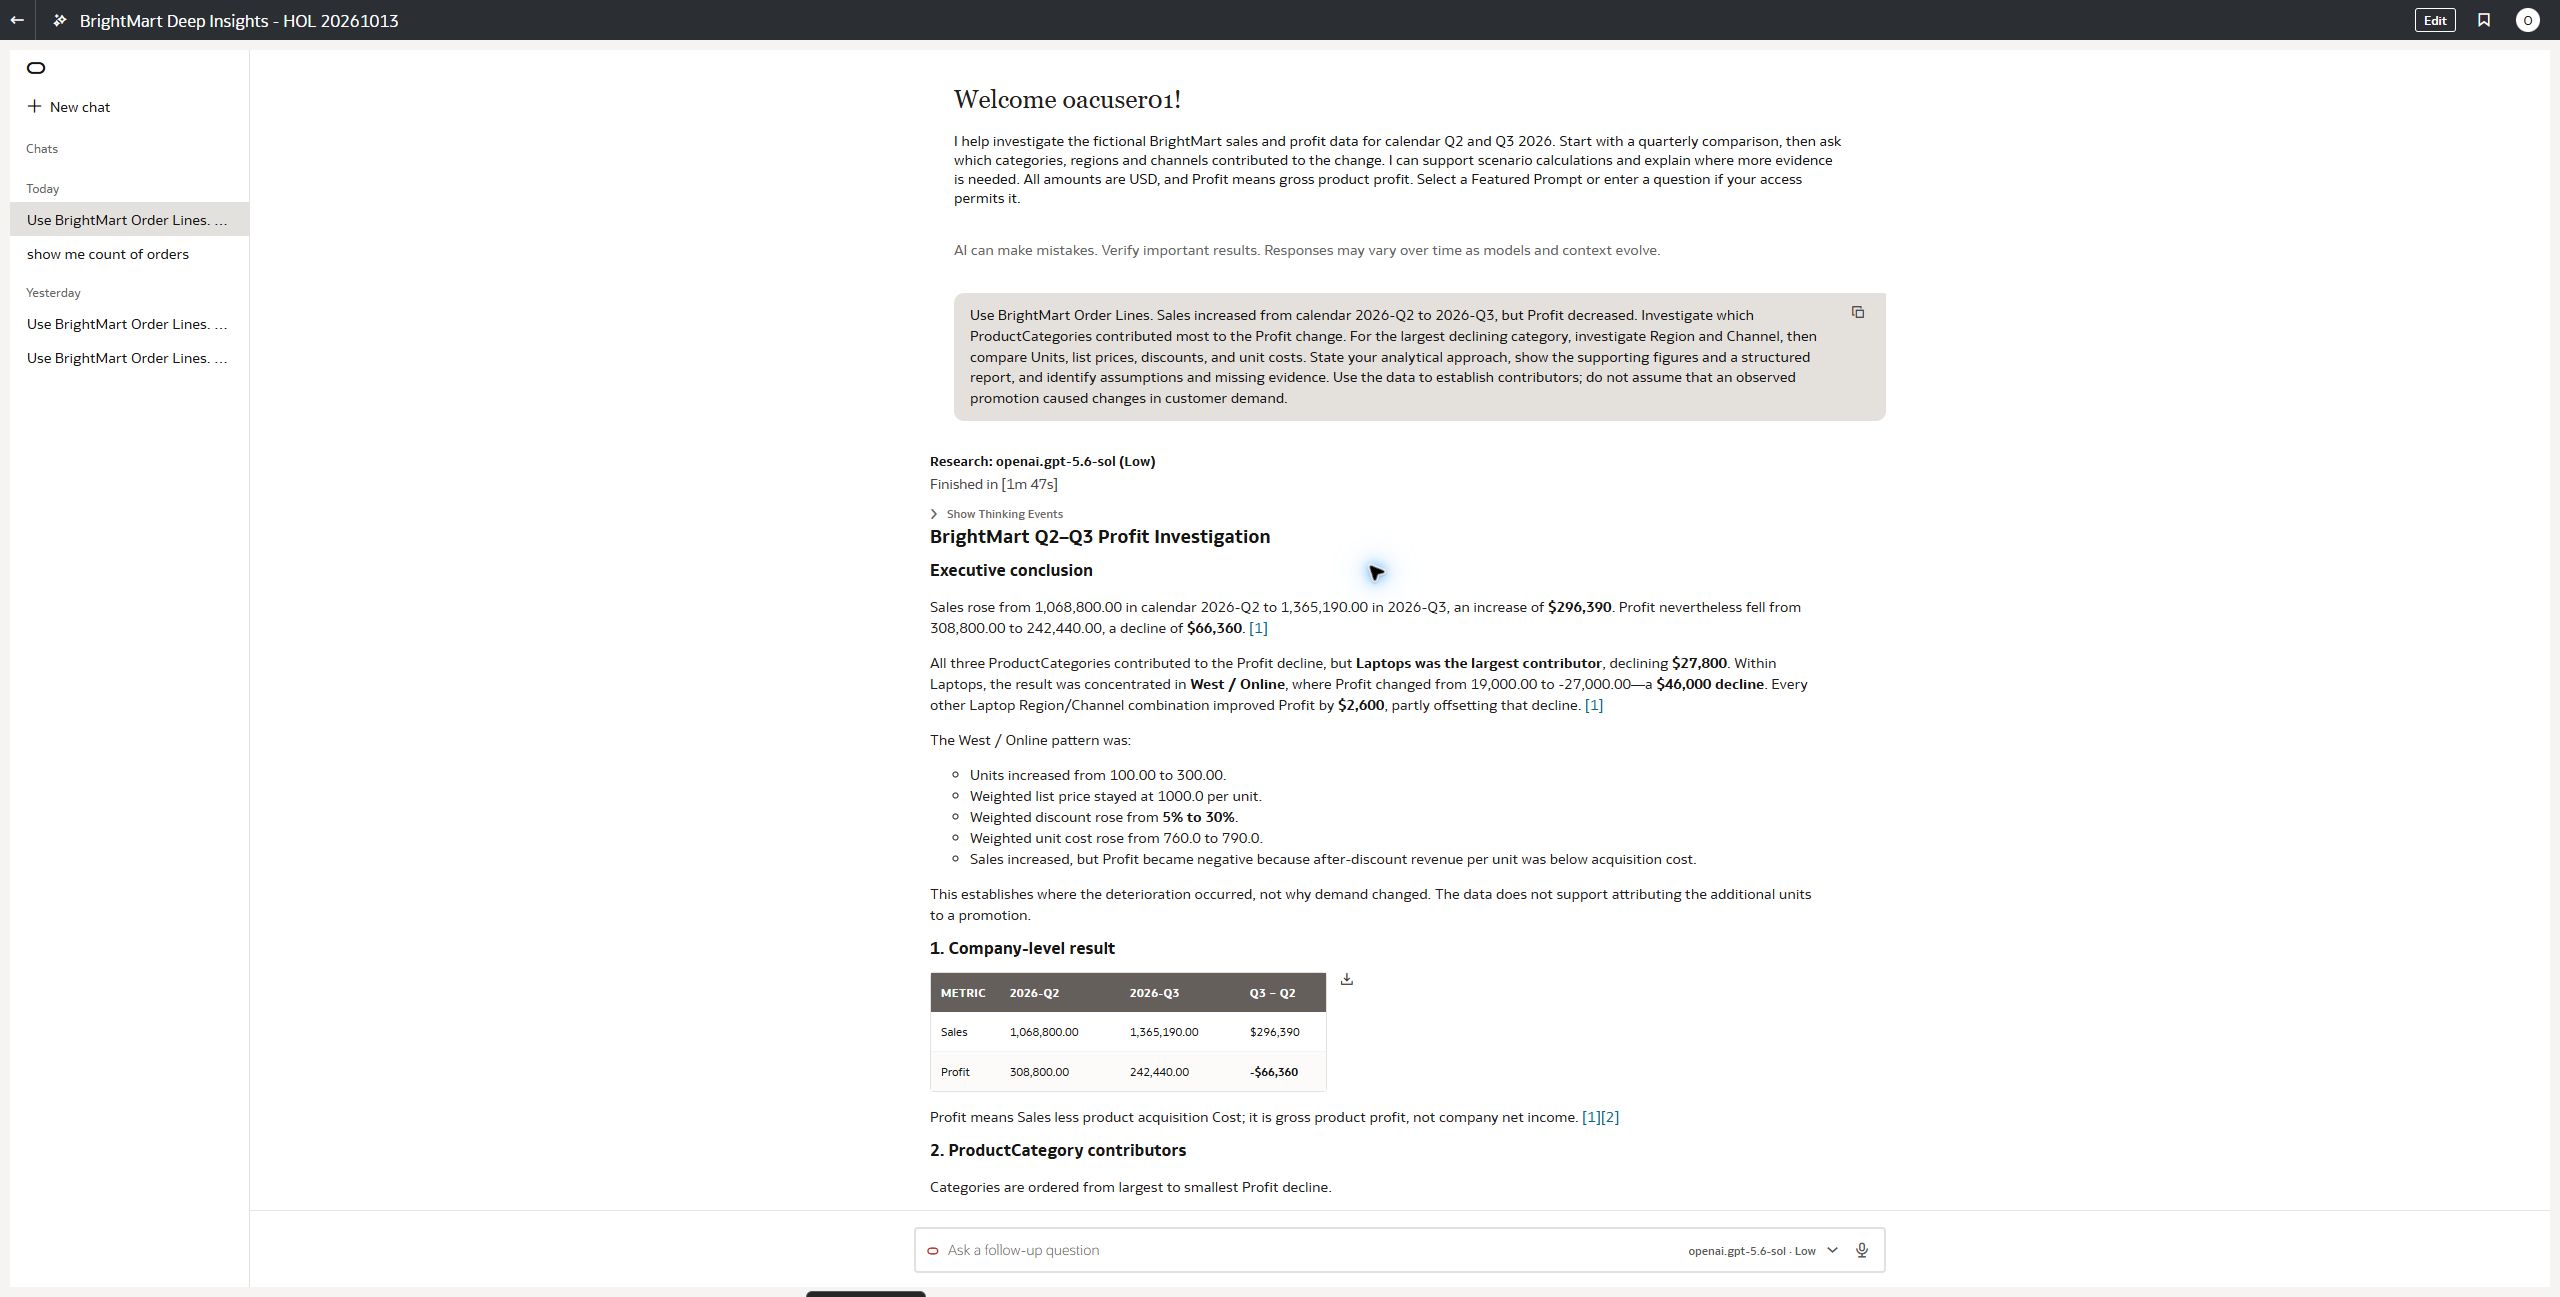
The same broad prompt stopped at an out-of-scope response in the observed Data Agent run. DI moved from quarter totals to category contributions and then a region/channel segment. Inspect the actual tool steps and report evidence.
WHAT WE OBSERVED ON AIW2
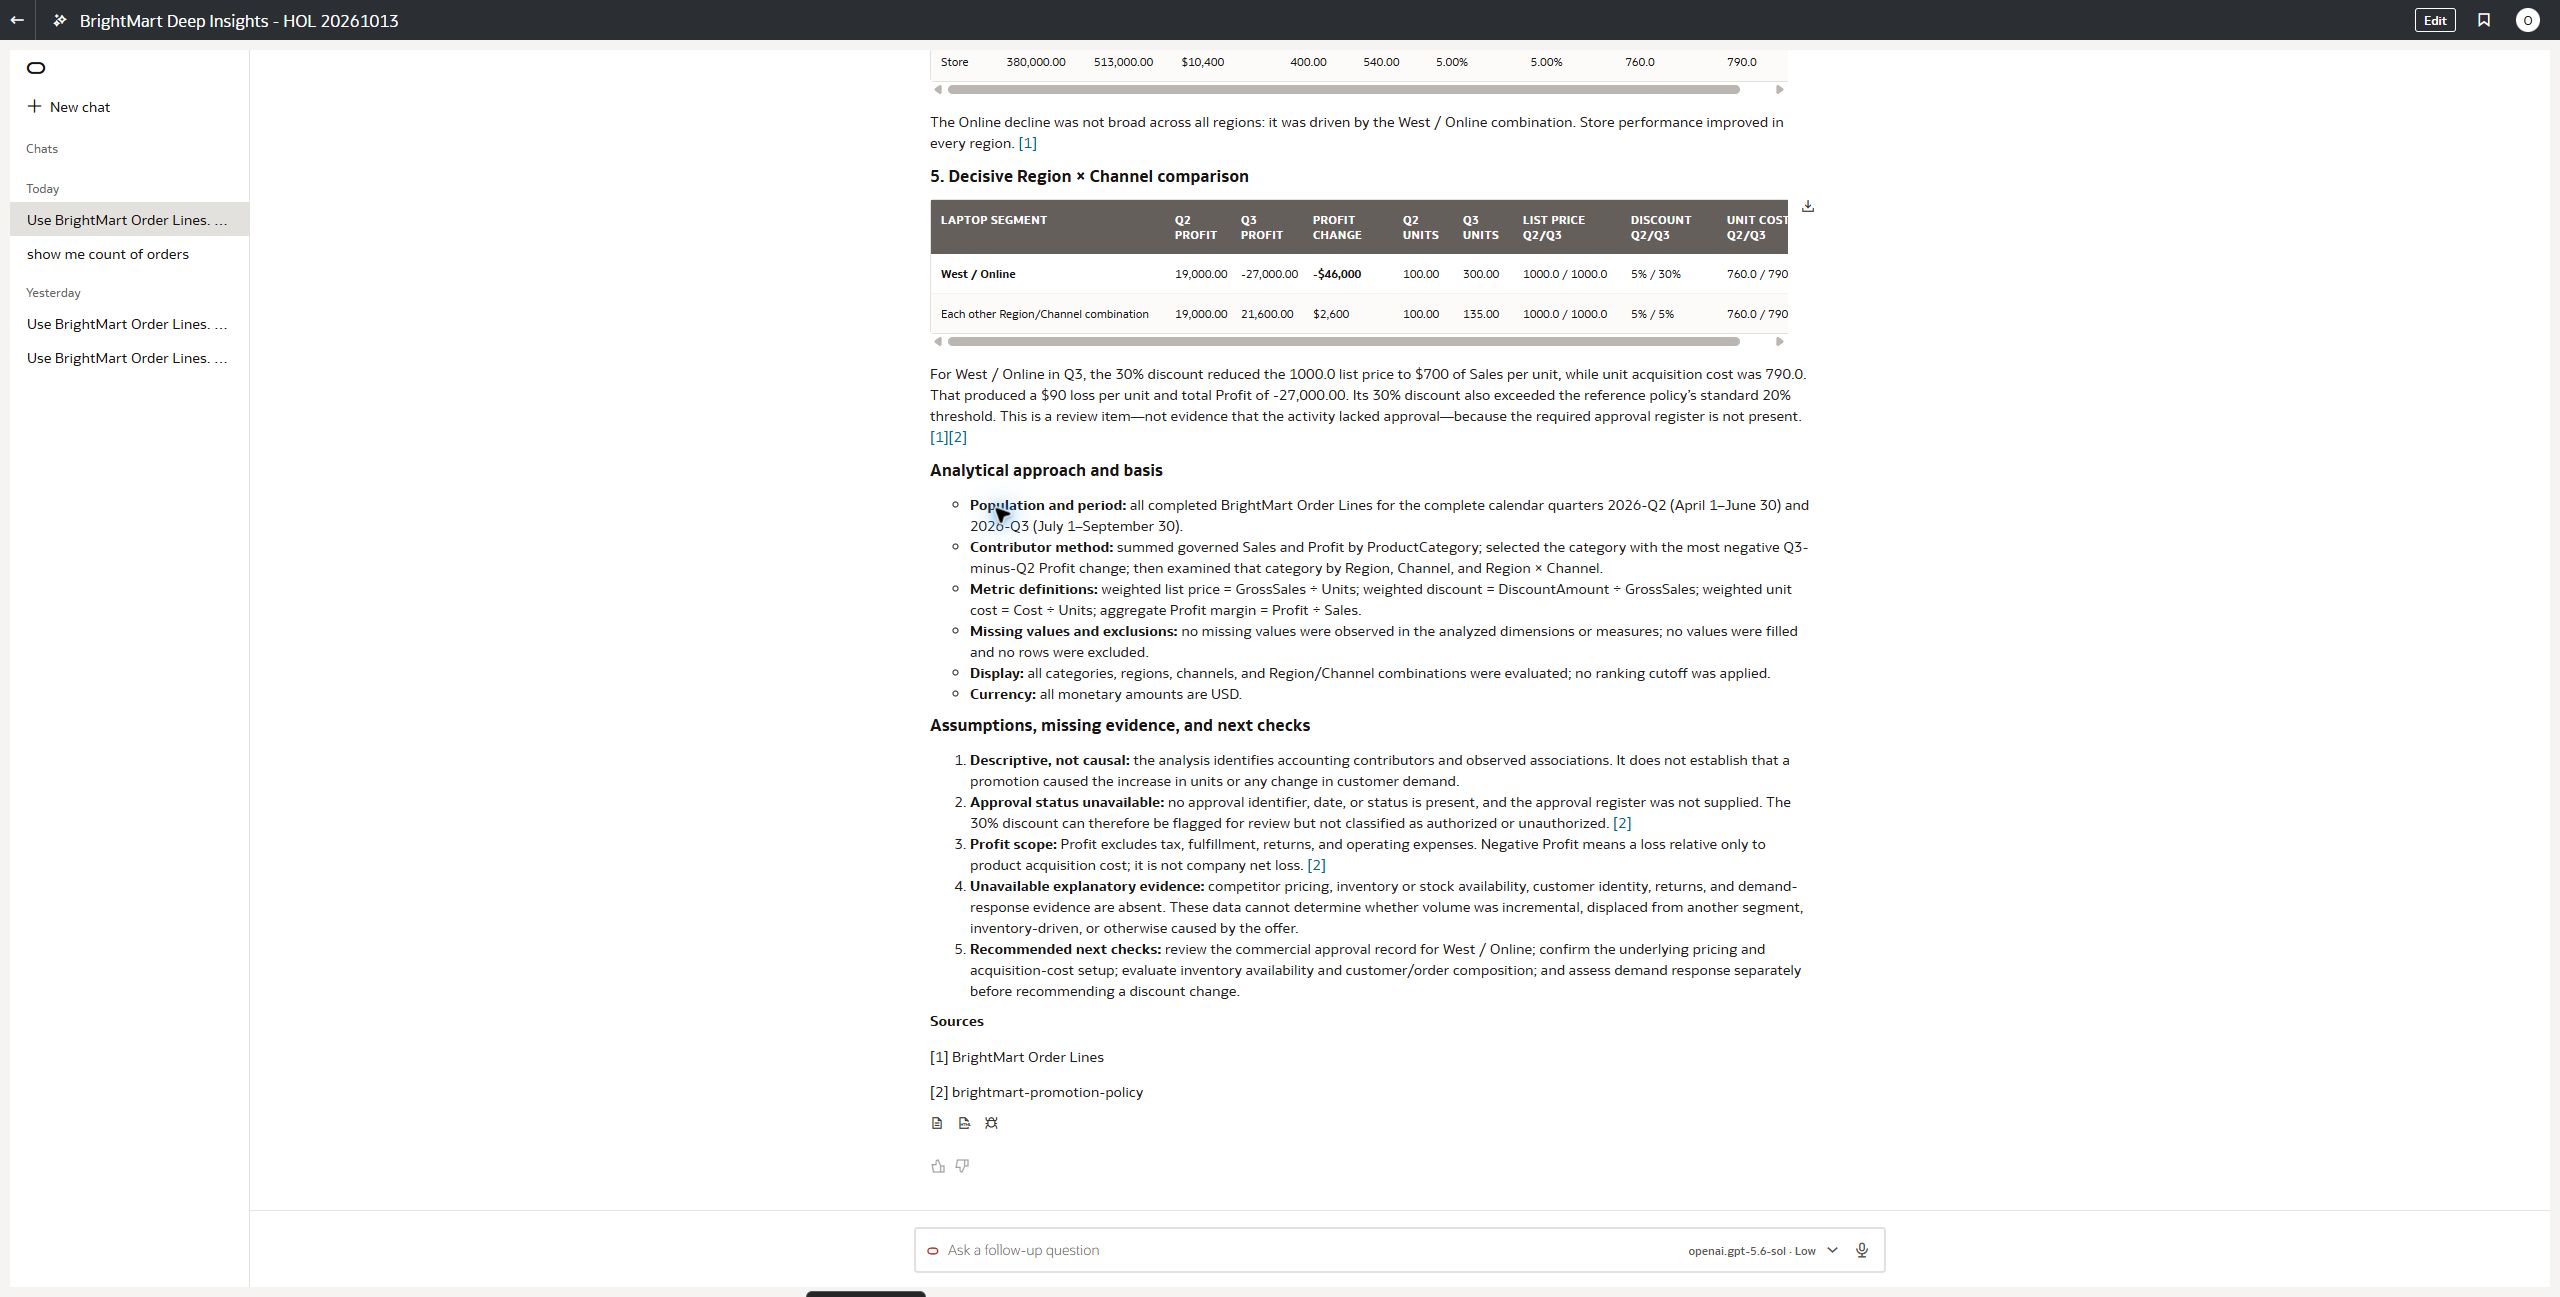
DI found Laptops −$27,800, Accessories −$23,200 and Headphones −$15,360 in quarter-over-quarter Profit. West / Online Laptops moved from $19,000 to −$27,000 while units rose 100 to 300, recorded discount rose 5% to 30%, and unit cost rose $760 to $790.
WHAT TO LOOK FOR
In the observed aiw2 run, the Data Agent replied that the request was beyond the scope of the data. DI continued from company totals to category contributors and West / Online Laptops. Verify those steps in Thinking Events and the supporting figures.
Action this result supports: Prioritize West / Online Laptops for pricing and unit-cost review; segment Profit changed by −$46,000.
Evidence boundary: A discount and a demand change occurring together do not prove the promotion caused demand.
AFTER YOUR AGENT RUN
Compare the observed evidence
Supporting screenshots (3)
CASE 3 OF 5 · DI Research · 8 min
Test a discount scenario
Use DI Research to request four fixed-volume discount scenarios. Locate the governed actuals and the Python calculation event.
Business questionKeep units, list price, cost and other orders fixed. Ask for a transparent arithmetic sensitivity table and inspect whether Python executed.
ASK THE PREPARED AGENT8 min
TESTED PROMPT
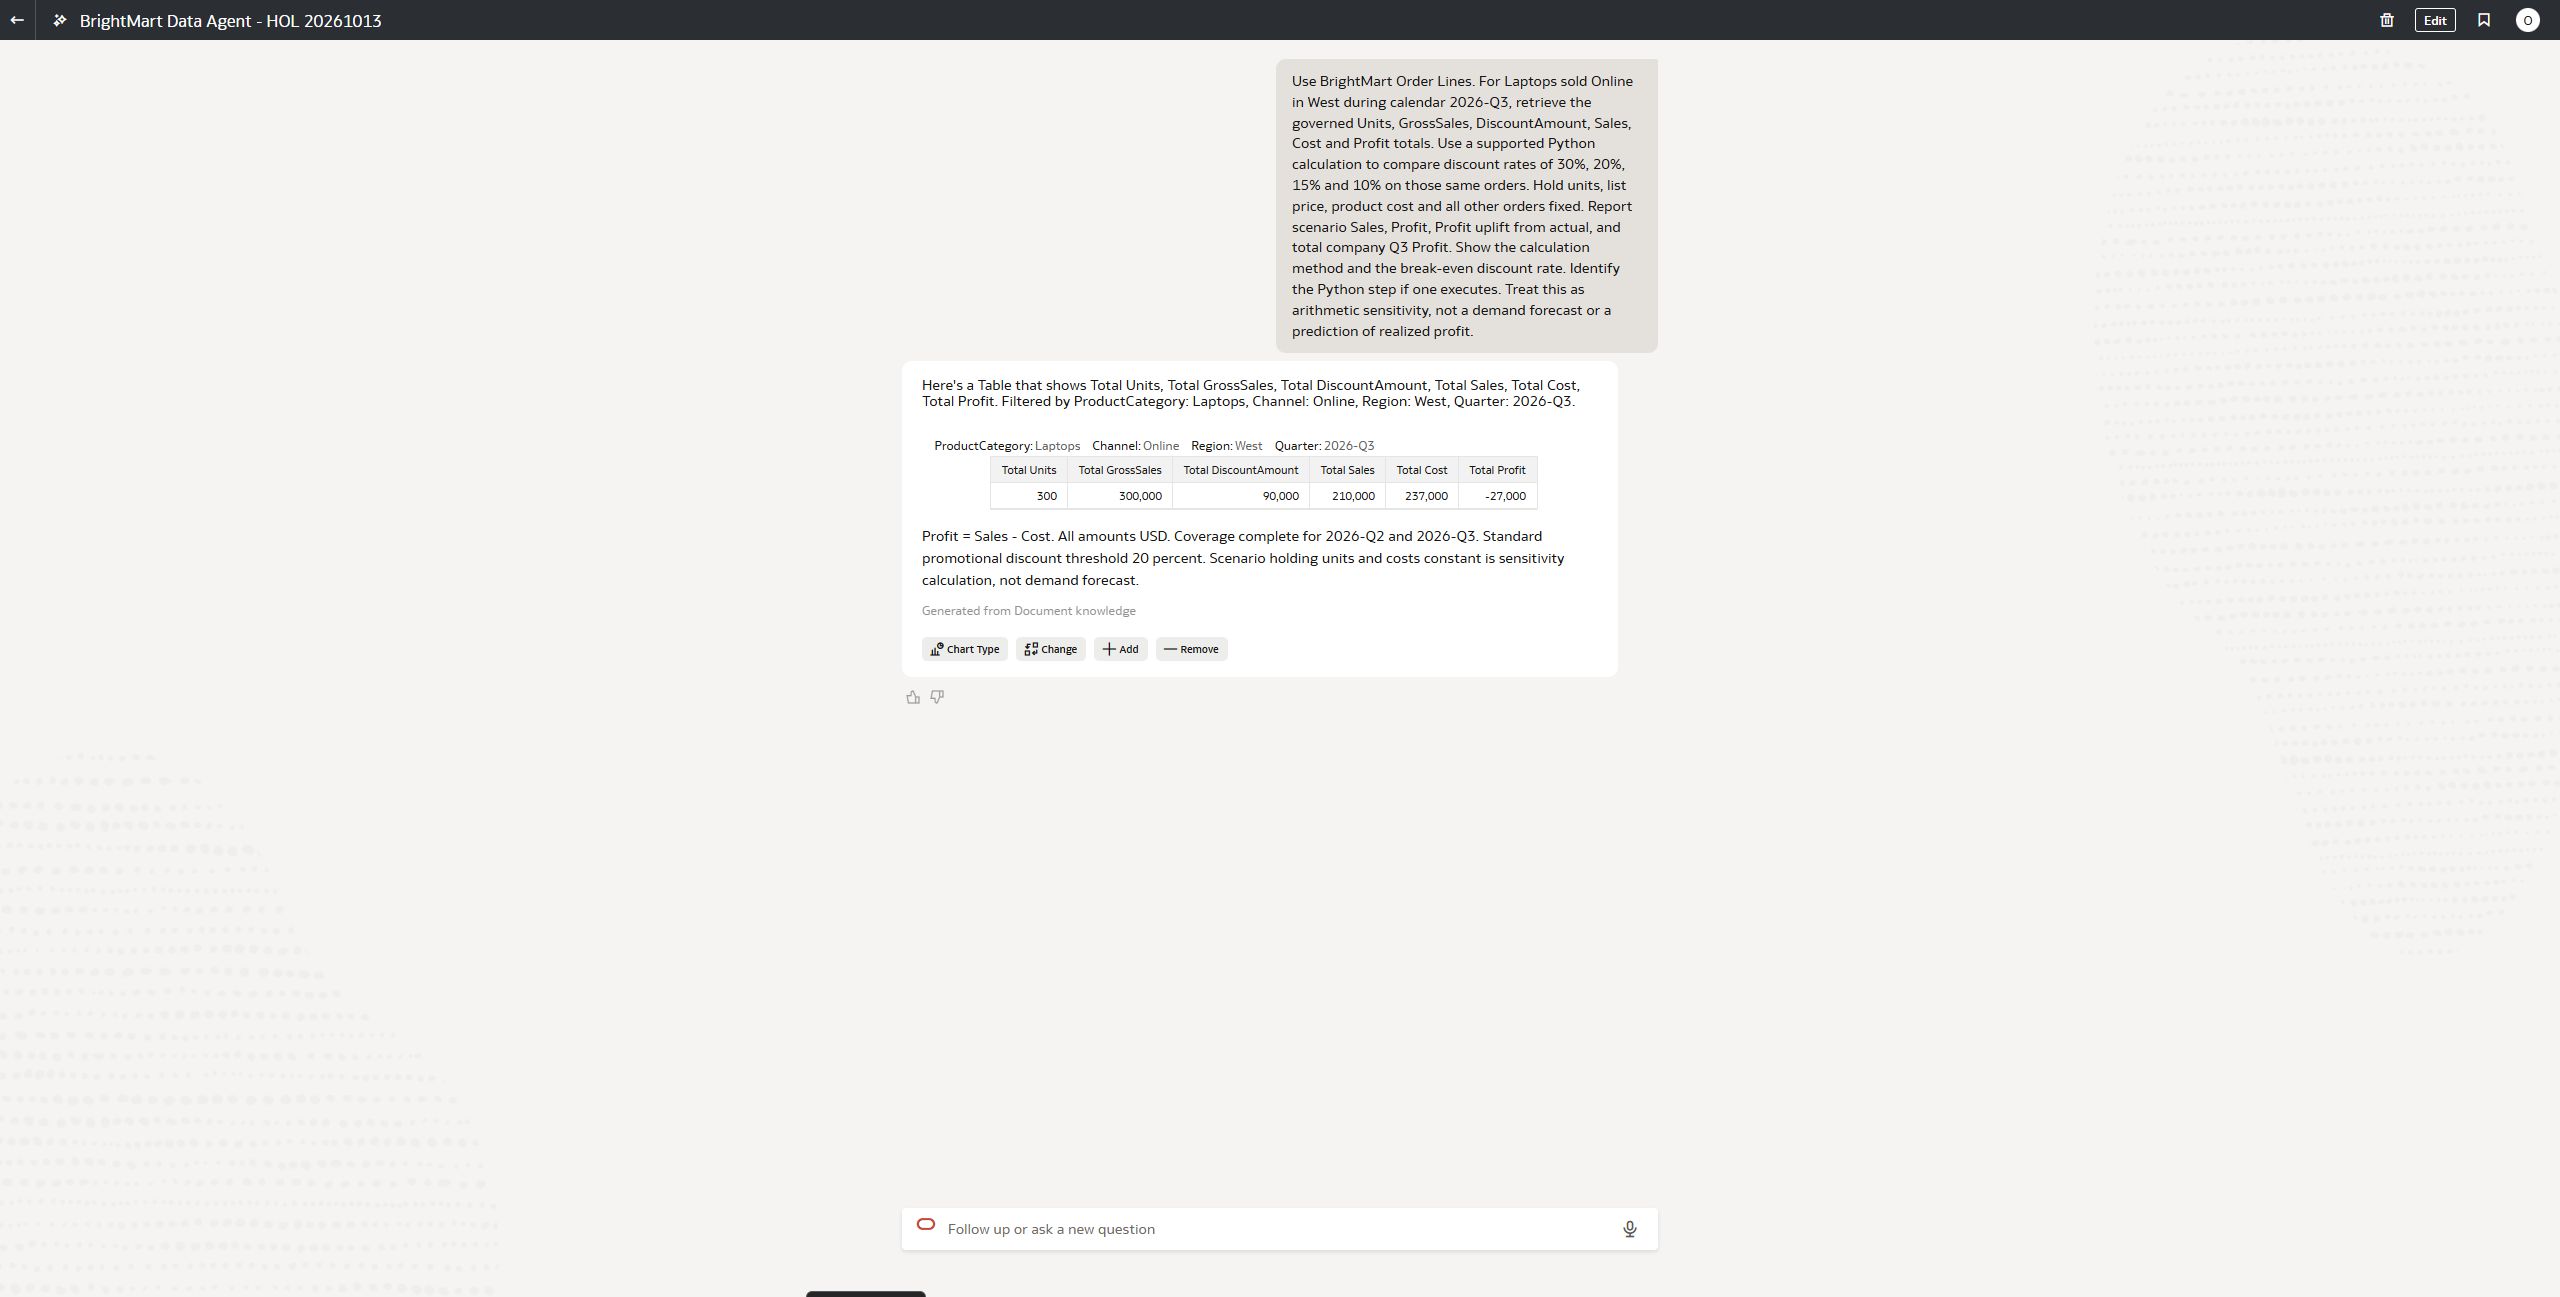
Use BrightMart Order Lines. For Laptops sold Online in West during calendar 2026-Q3, retrieve the governed Units, GrossSales, DiscountAmount, Sales, Cost and Profit totals. Use a supported Python calculation to compare discount rates of 30%, 20%, 15% and 10% on those same orders. Hold units, list price, product cost and all other orders fixed. Report scenario Sales, Profit, Profit uplift from actual, and total company Q3 Profit. Show the calculation method and the break-even discount rate. Identify the Python step if one executes. Treat this as arithmetic sensitivity, not a demand forecast or a prediction of realized profit.
Before you run: predict the agent's route
Which values should come from governed data, and which arithmetic can Python perform after retrieval?
DEEP INSIGHTS FEATURE TO OBSERVEOptional Python calculation
DI can use governed results as inputs to repeatable scenario arithmetic. Verify that Python actually ran in this observed case and read its assumptions.
WHAT TO POINT OUT IN CASE 3
DI has a managed Python analysis step
Open Show Thinking Events after the fixed-volume discount question. In the observed BrightMart run, DI first retrieved governed totals and then invoked Python for the four scenario calculations. Inspect the executed tool step and returned values; a sentence in the final report saying “Python” is not execution evidence.
The downloaded debug record for that run contains an execute_python_code call with generated code_to_execute importing pandas and numpy, followed by a returned scenario result. The managed runtime supplied those packages for this observed run; participants did not install them. The available package set depends on the service build, so this lab does not promise every Python library or a Python call for every question.
Governed OAC totals→ Python scenario arithmetic→ Checked report
WHAT WE OBSERVED ON AIW2
At 30% discount, West / Online Laptop Profit was −$27,000. A 20% rate yields $3,000 under the fixed-volume assumptions, a $30,000 uplift; company Q3 Profit becomes $272,440. Break-even is 21%.
WHAT TO LOOK FOR
Check the four scenario rows, the 21% break-even rate, and the trace. Python is optional; the tool event and calculation show what actually ran.
Action this result supports: Take the 20% option to a controlled commercial test. Its fixed-volume calculation adds $30,000 Profit; measure actual units and Profit before rollout.
Evidence boundary: The hypothetical discount change holds quantity and costs fixed; it does not predict customer behavior.
AFTER YOUR AGENT RUN
Compare the observed evidence
Supporting screenshots (1)
CASE 4 OF 5 · DI Research · 9 min
Compare actuals with targets
Use DI Research with both prepared sources. Check the Quarter and Region match before accepting the shortfall calculation.
Business questionUse order lines and quarterly targets as separate sources. Match only after actual Profit is aggregated to Quarter and Region.
ASK THE PREPARED AGENT9 min
TESTED PROMPT
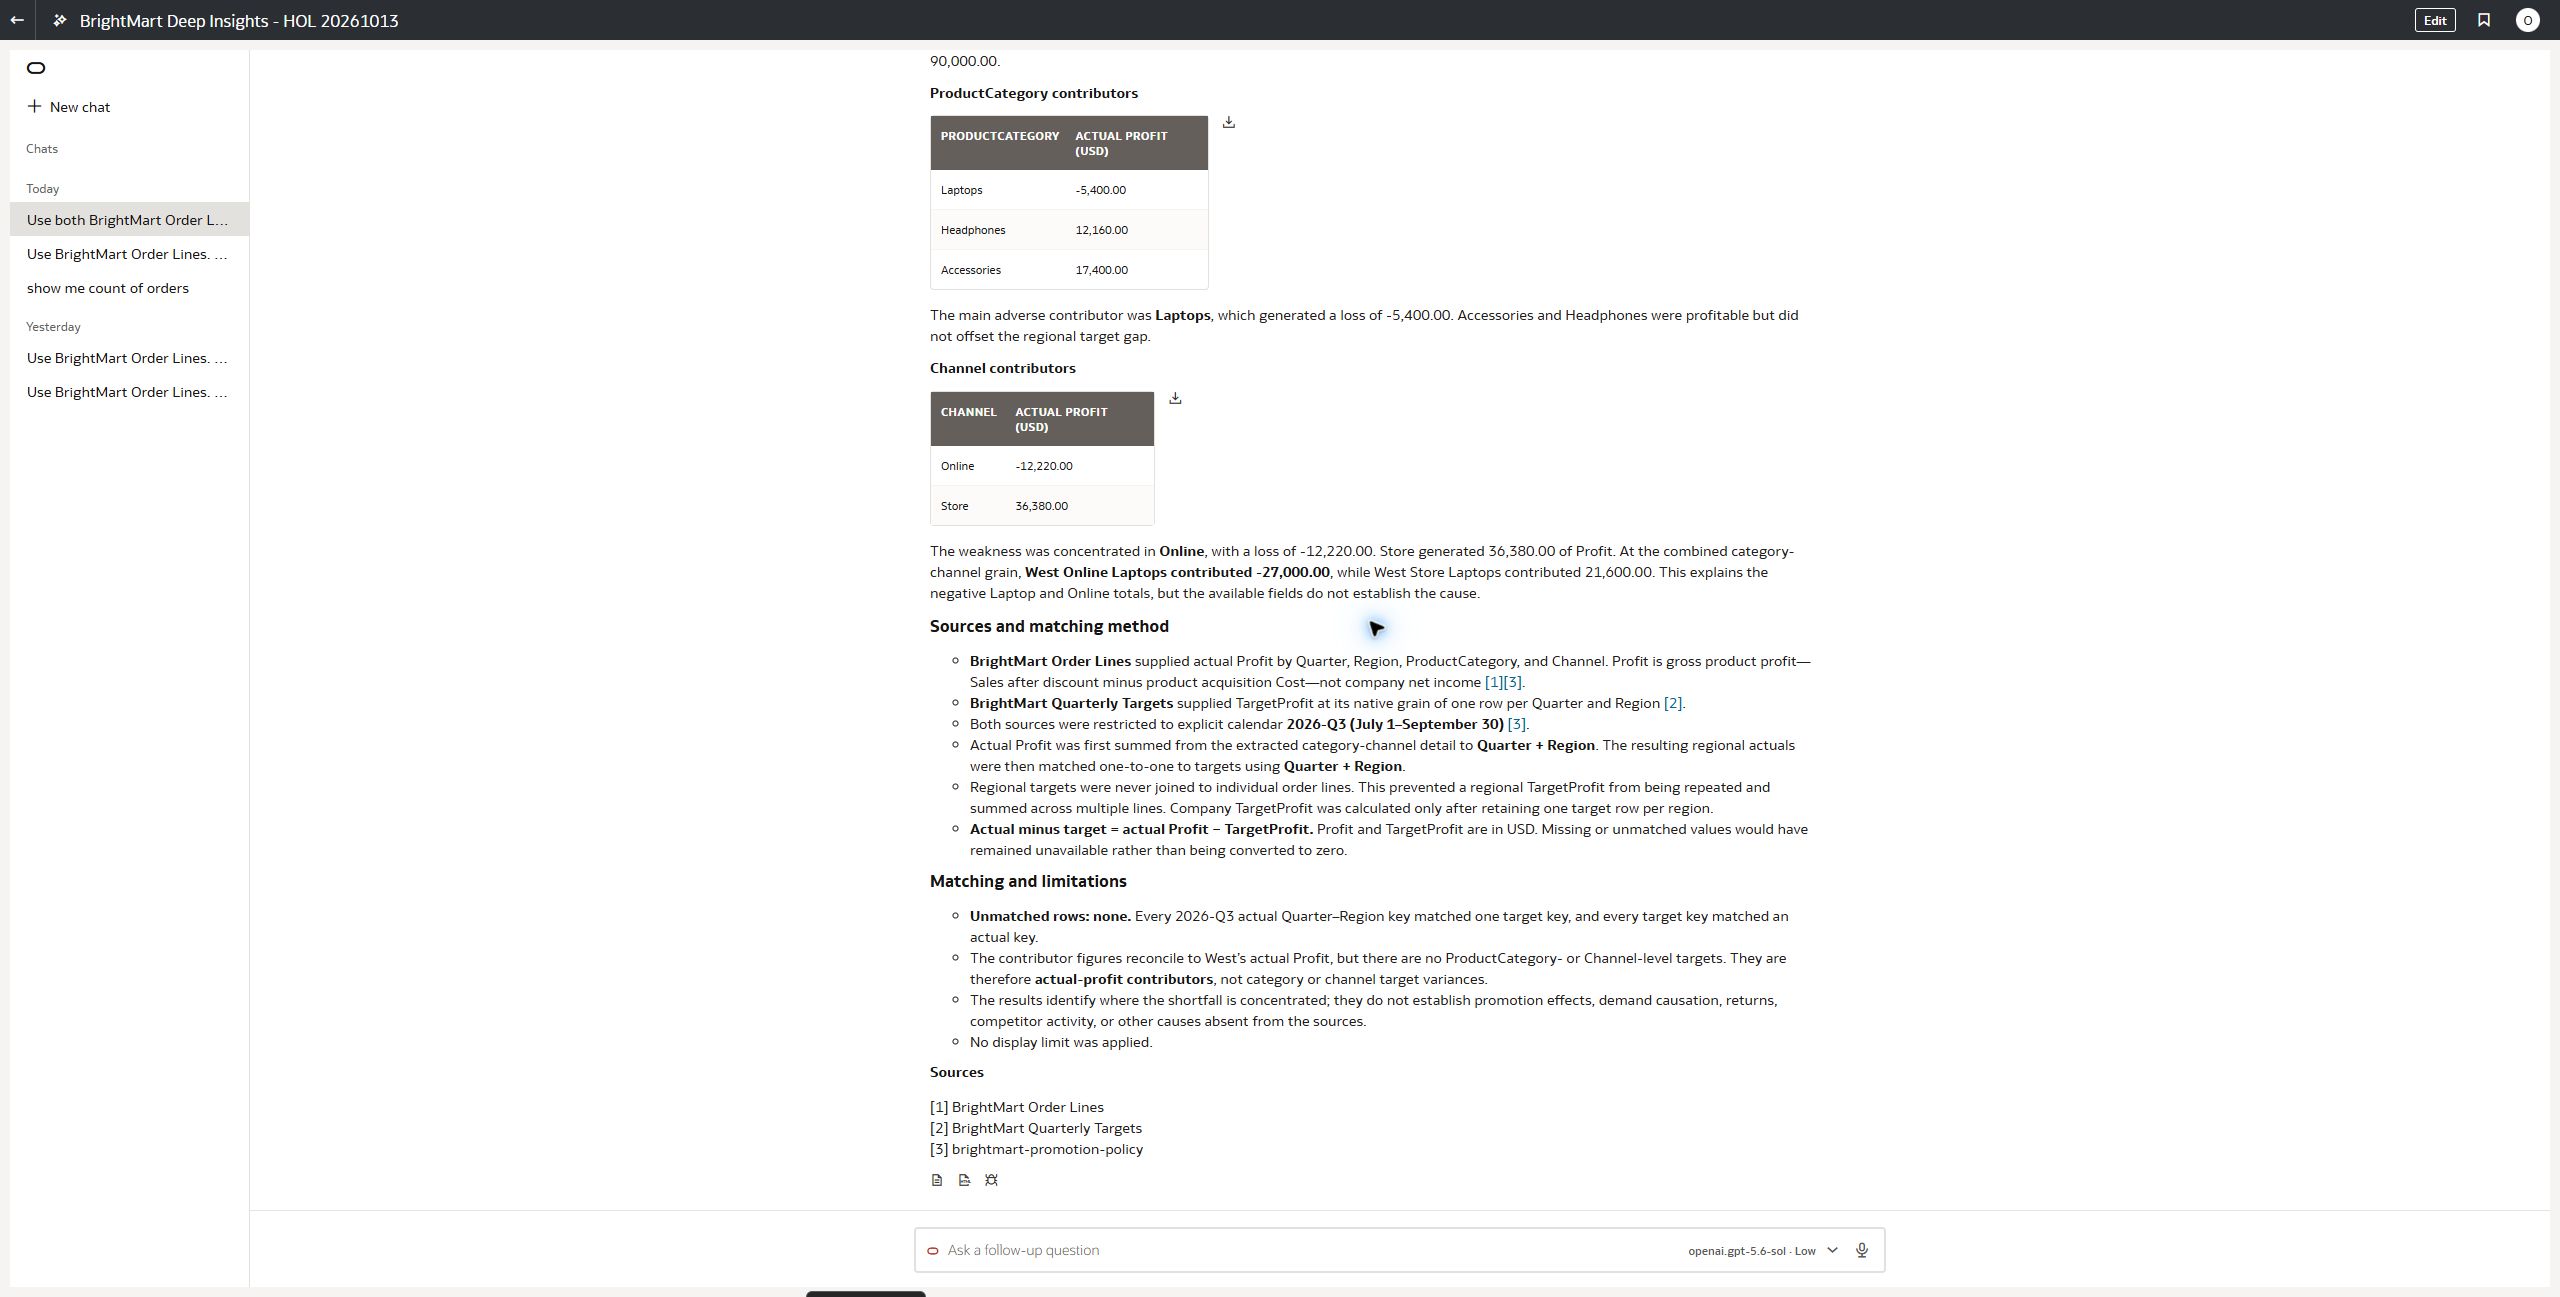
Use both BrightMart Order Lines and BrightMart Quarterly Targets as separate data sources. For calendar 2026-Q3, aggregate actual Profit to Quarter and Region before comparing with TargetProfit at the same grain. Show actual Profit, TargetProfit, and actual minus target for every Region and the company total. Identify the largest shortfall and use Order Lines to investigate its ProductCategory and Channel contributors. Describe the sources, matching keys, and how you avoided duplicating a regional target across order lines. Identify any unmatched rows.
Before you run: predict the agent's route
At what common grain can the two datasets be matched without repeating a regional target?
DEEP INSIGHTS FEATURE TO OBSERVECoordinate two sources
DI queries Order Lines and Quarterly Targets separately, then compares them at Quarter × Region grain.
WHAT WE OBSERVED ON AIW2
Company actual Q3 Profit $242,440 versus target $330,000: a shortfall of $87,560. West accounts for $65,840 of the gap. There were no unmatched rows.
WHAT TO LOOK FOR
Look for two governed source results, Quarter × Region matching, no unmatched rows and a company target comparison. Do not duplicate targets on every order line.
Action this result supports: Focus the regional recovery plan on West, which accounts for $65,840 of the $87,560 Q3 target gap.
Evidence boundary: Category and channel target variance cannot be computed because only regional targets were supplied.
AFTER YOUR AGENT RUN
Compare the observed evidence
Supporting screenshots (2)
CASE 5 OF 5 · Data Agent + DI Research · 8 min
Add policy context and judge evidence
Ask both prepared agents to combine order evidence with the attached policy. Separate a policy threshold from proof of approval.
Business questionAsk both agents about the attached policy. Compare the policy citation, numerical evidence, and what they say about approval status.
ASK THE PREPARED AGENT8 min
TESTED PROMPT
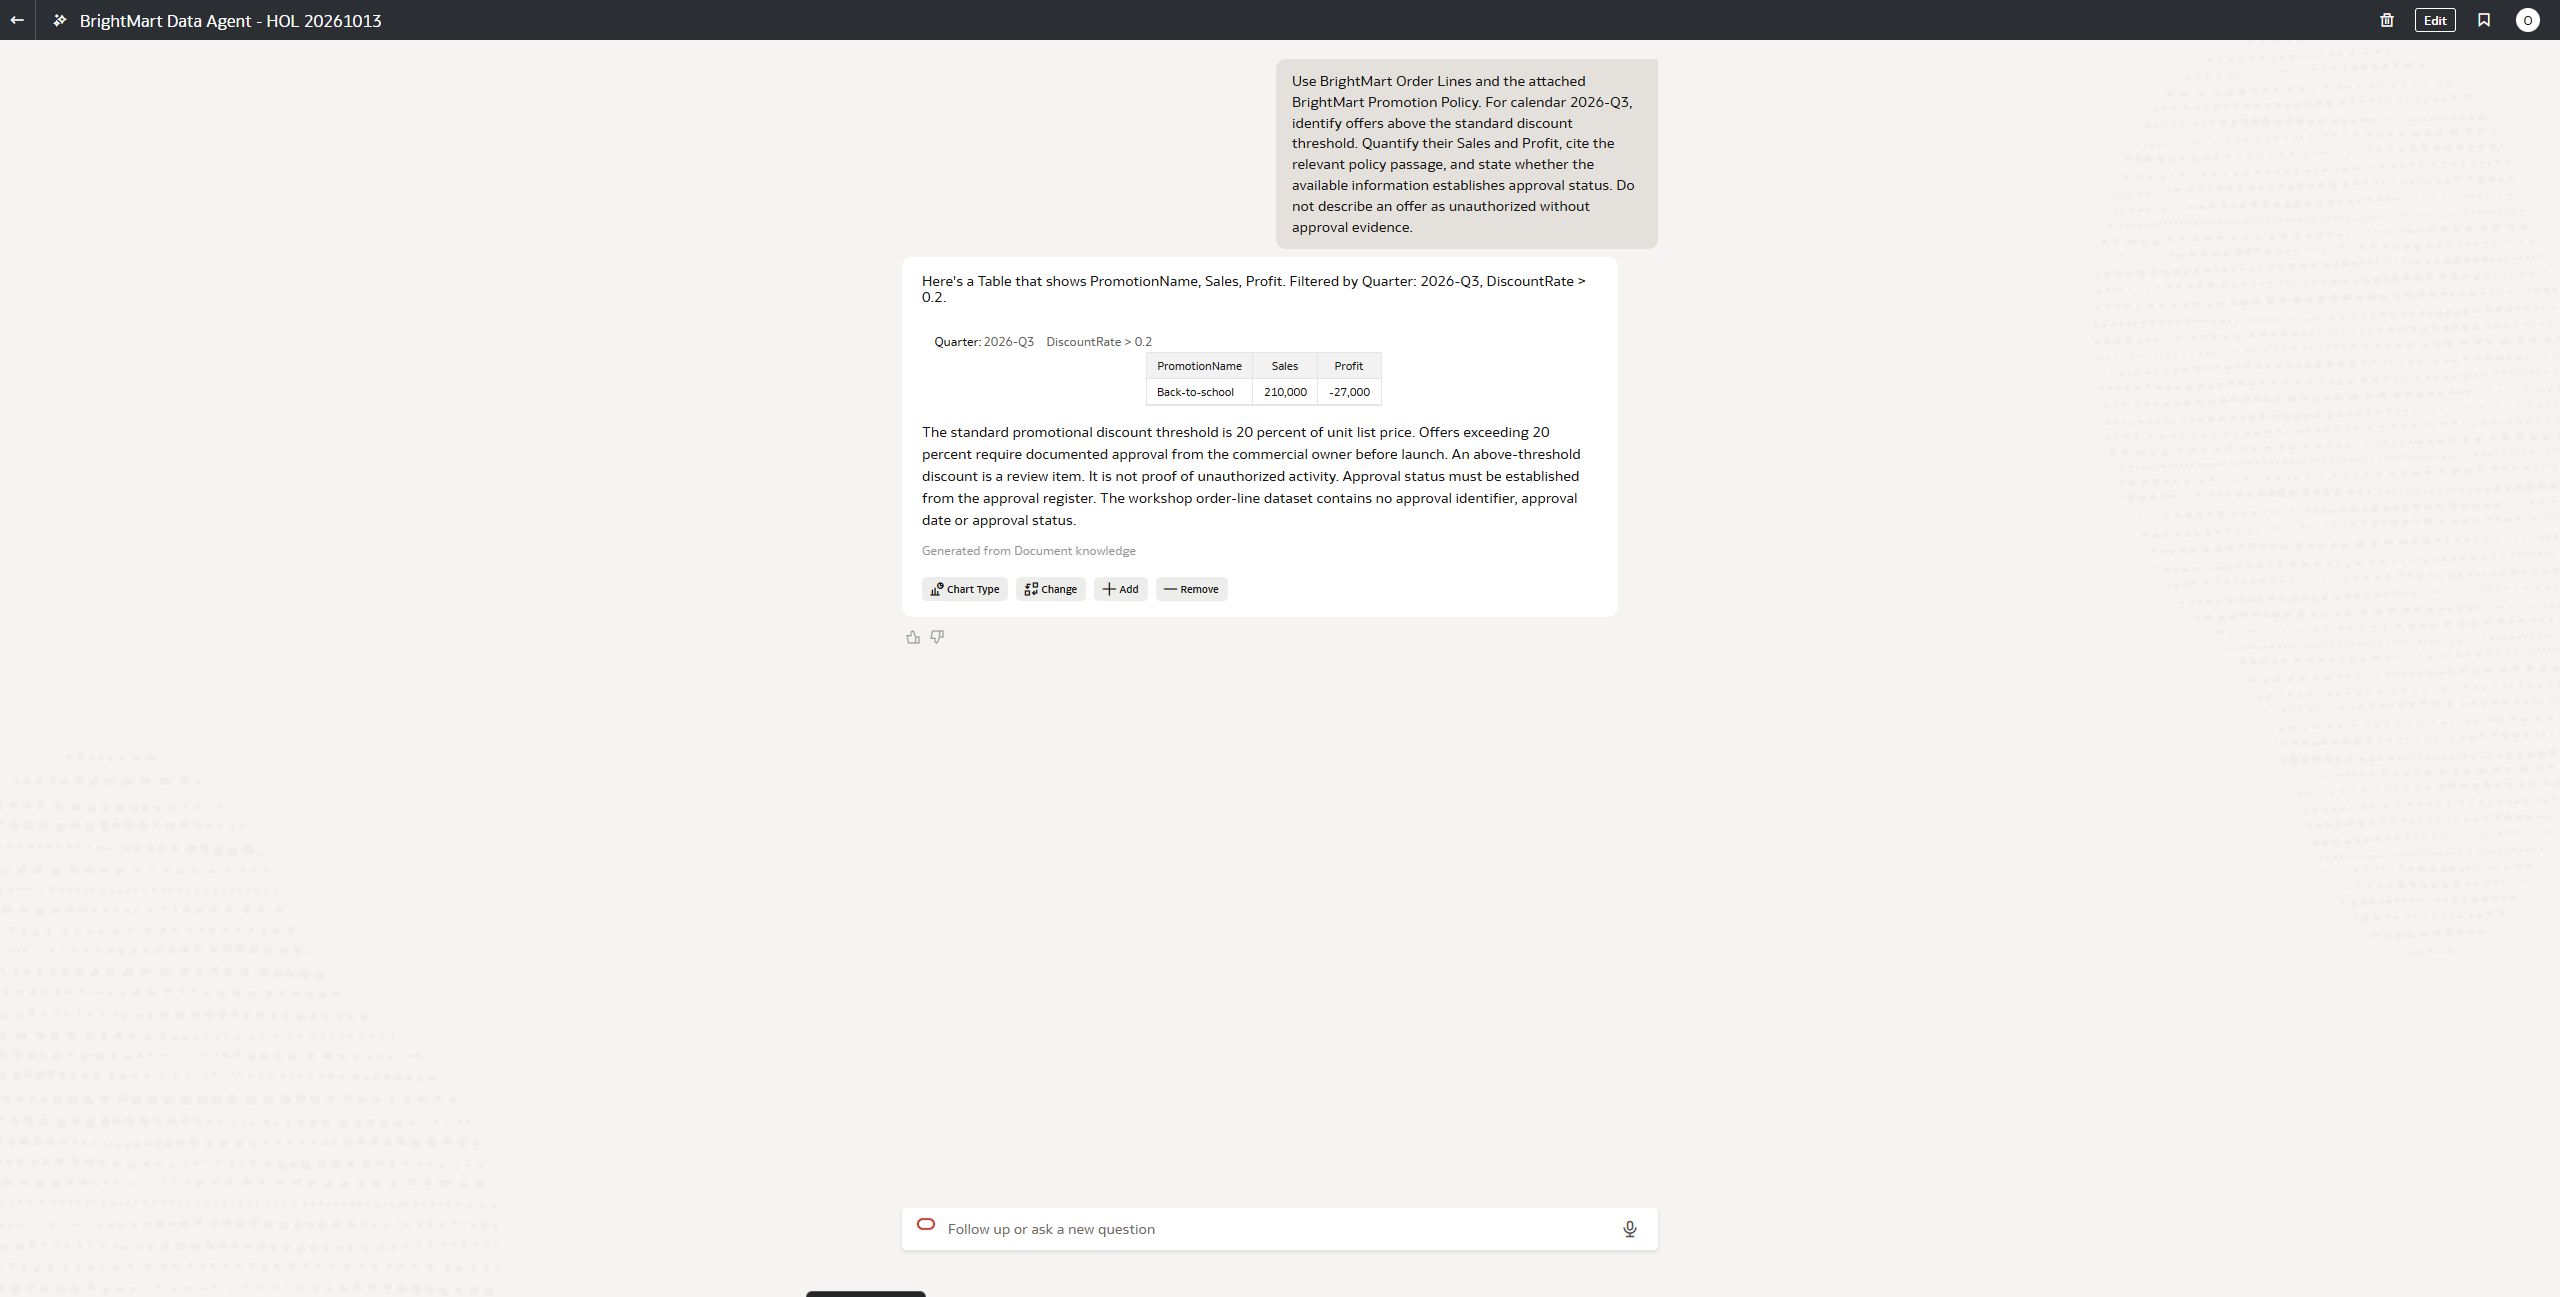
Use BrightMart Order Lines and the attached BrightMart Promotion Policy. For calendar 2026-Q3, identify offers above the standard discount threshold. Quantify their Sales and Profit, cite the relevant policy passage, and state whether the available information establishes approval status. Do not describe an offer as unauthorized without approval evidence.
Before you run: predict the agent's route
Which statement comes from order data, and which comes from the policy document?
DEEP INSIGHTS FEATURE TO OBSERVECombine data with private knowledge
DI brings together a governed discount result and a retrieved policy rule to recommend an approval review. The Data Agent can also retrieve the policy.
WHAT WE OBSERVED ON AIW2
One 30% Q3 offer exceeds the standard 20% threshold. Its Sales were $210,000 and Profit −$27,000. The attached policy requires documented approval above 20%, while the available order-line data contains no approval record; this is a review item, not proof of unauthorized activity.
WHAT TO LOOK FOR
Both agents can retrieve policy text. DI adds a structured evidence review and identifies the 30% offer for an approval-record review.
Action this result supports: Send the 30% offer to the commercial owner for an approval-record review and document the decision.
Evidence boundary: Above-threshold does not mean unauthorized without the approval evidence.
AFTER YOUR AGENT RUN
Compare the observed evidence
Supporting screenshots (1)
FROM ANSWER TO EVIDENCE
Inspect what DI actually did
Open Show Thinking Events for a completed response; compare a simple request with a scenario request.
What you may see
Source inspection, reviewed descriptions, natural language to Logical SQL, governed query results, optional Python, policy retrieval and a structured final report. DI can evaluate intermediate findings and run another step when it needs more evidence.
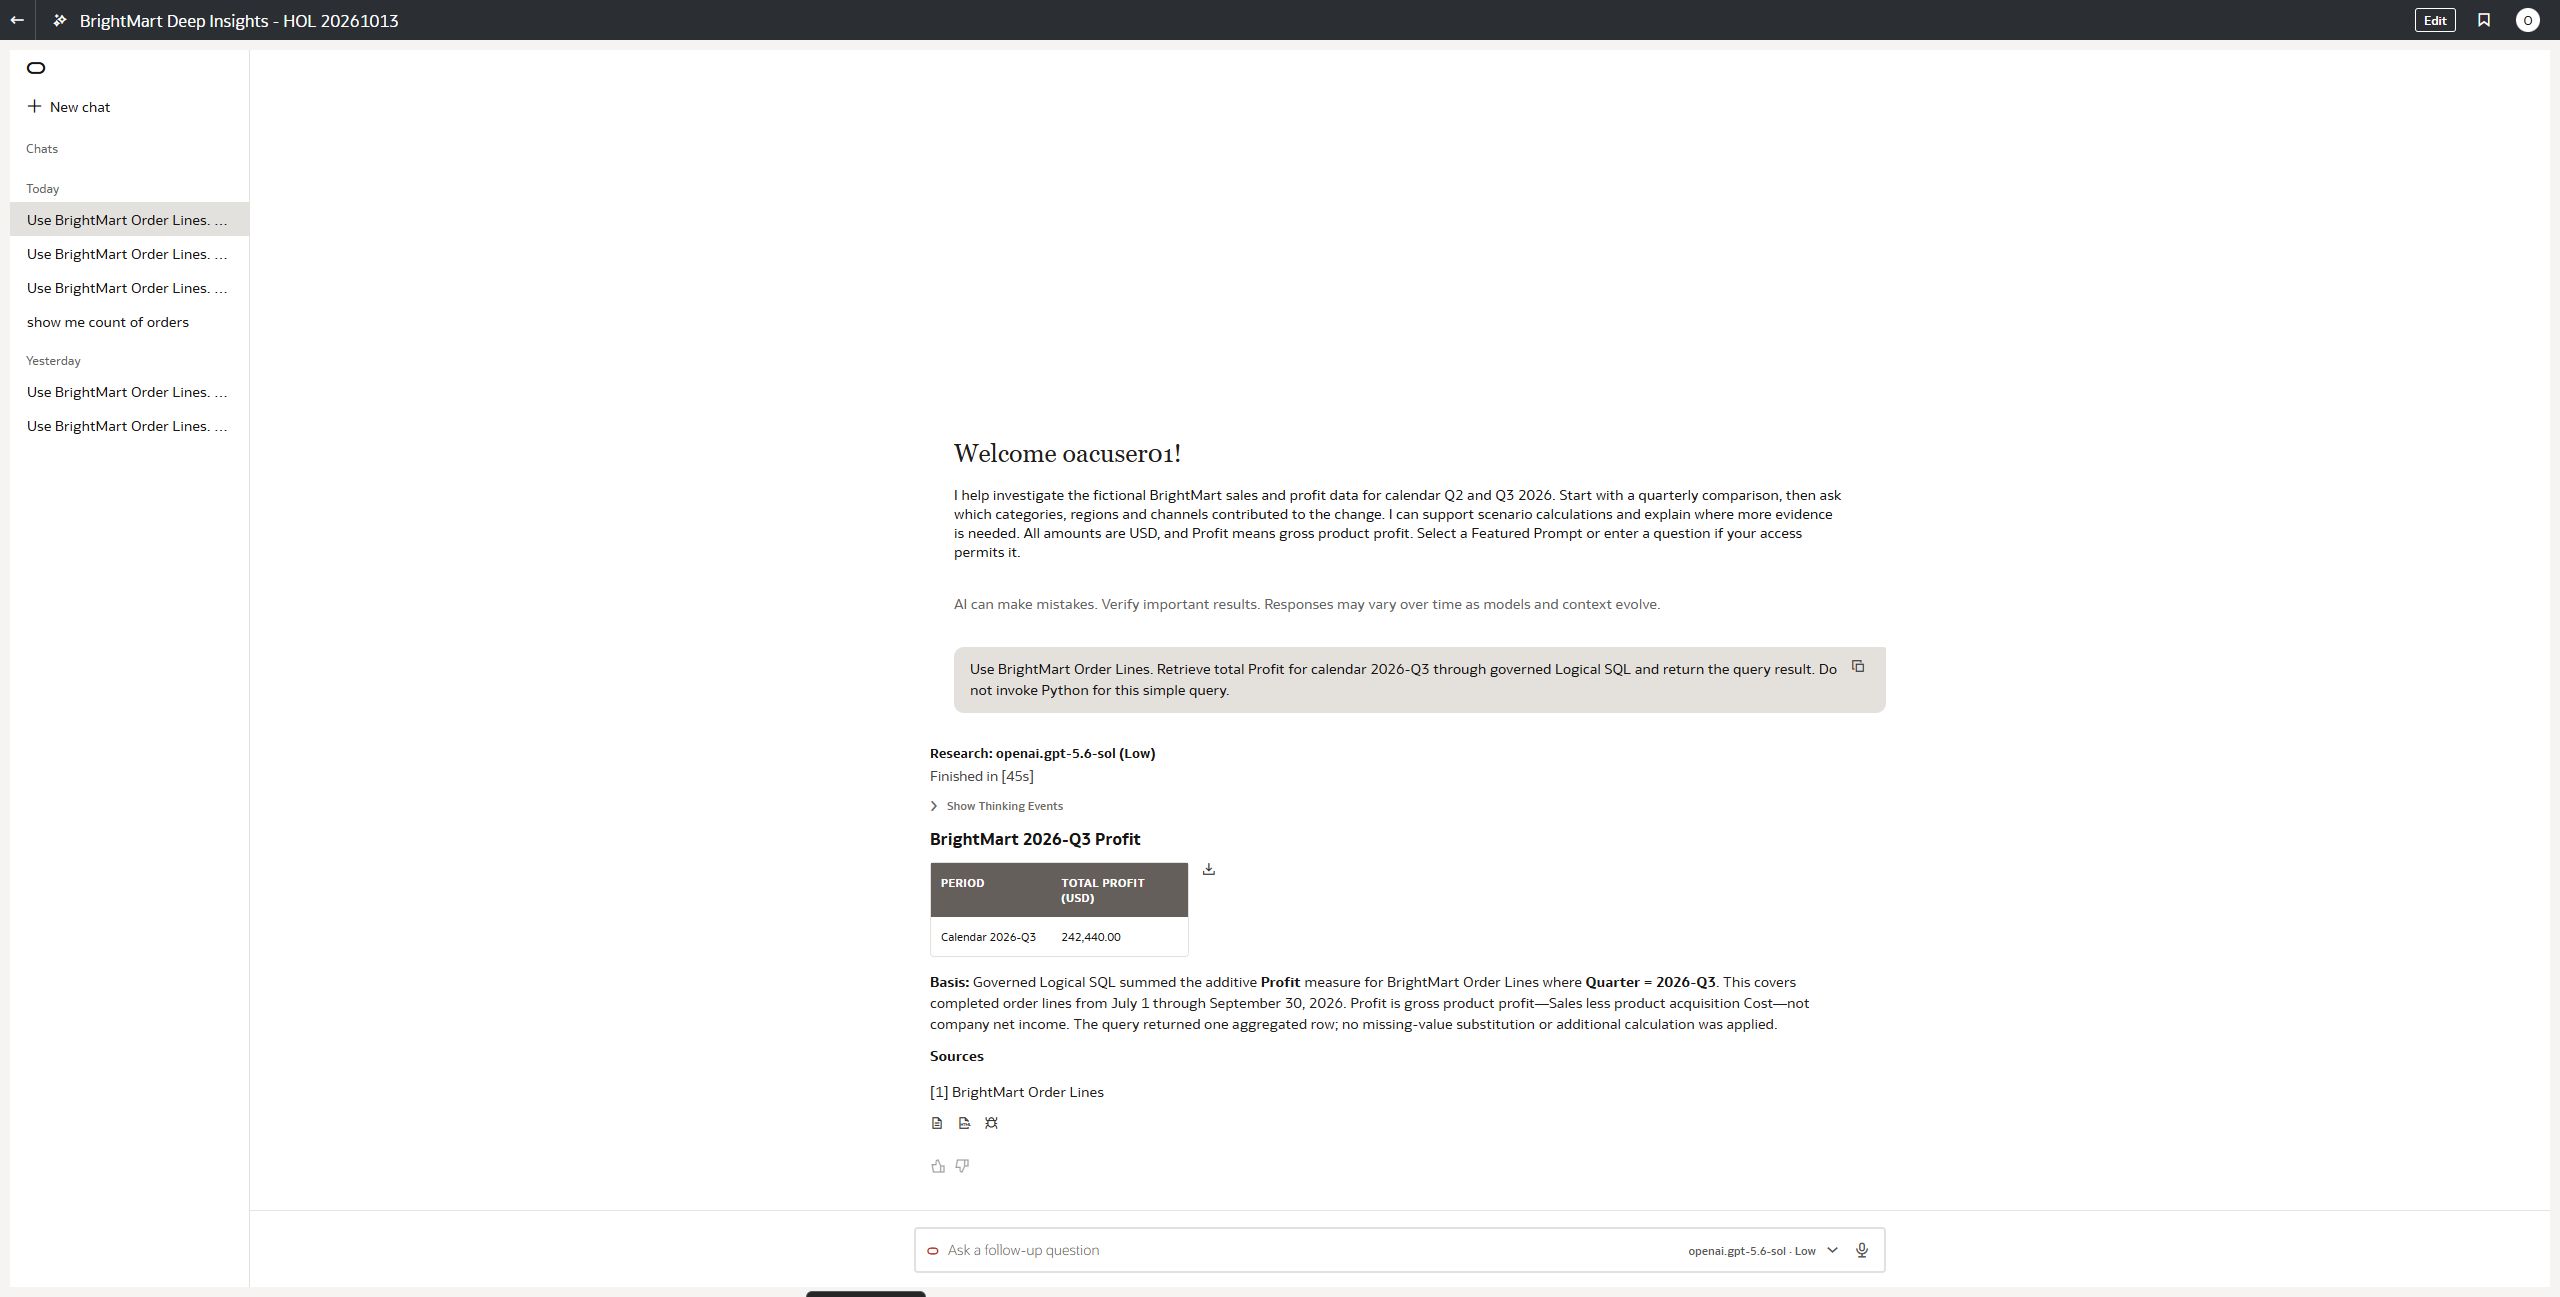
For the simple Q3 Profit control, the observed Research trace used Logical SQL without a Python event. The fixed-volume scenario used Python to calculate discount alternatives. A separate simple Instant run invoked Python internally for tool coordination. Read the actual event, rather than inferring analytical depth from the presence of “Python.”
What to validate
Check the source, time filter, measure formula, aggregation grain, arithmetic, source citation and stated uncertainty. The agent deciding it has “enough evidence” is a runtime judgment, not independent proof of correctness.
For Case 4, verify Quarter × Region before matching targets. For Case 5, verify the policy threshold and route the offer for approval-record review.
From one answer to a measurable run
1 · Read the answer2 · Inspect Thinking Events3 · Download4 · Give feedback5 · Measure usage
After Case 3, open Show Thinking Events. Locate the source, Logical SQL query/result, and the Python call and return if present. Use the response action controls to download the report; use the available debug or conversation-download control to save the conversation JSON. A table may also have its own download icon. Control labels vary by build, so use the tooltip in your instance.
Use the response feedback controls when the answer is helpful or incorrect. If you give negative feedback, name the specific error: wrong measure, missing category, unsupported conclusion, or failed tool step. Feedback helps owners find issues; it does not independently prove the answer right or wrong.
Look for candidate and selected sources, returned schema and AI Descriptions, tool inputs and returned results, and the final model and usage summary. A source-match score concerns candidate selection, not confidence in the final conclusion. For Python, confirm both invocation and successful result before describing the calculation as executed.
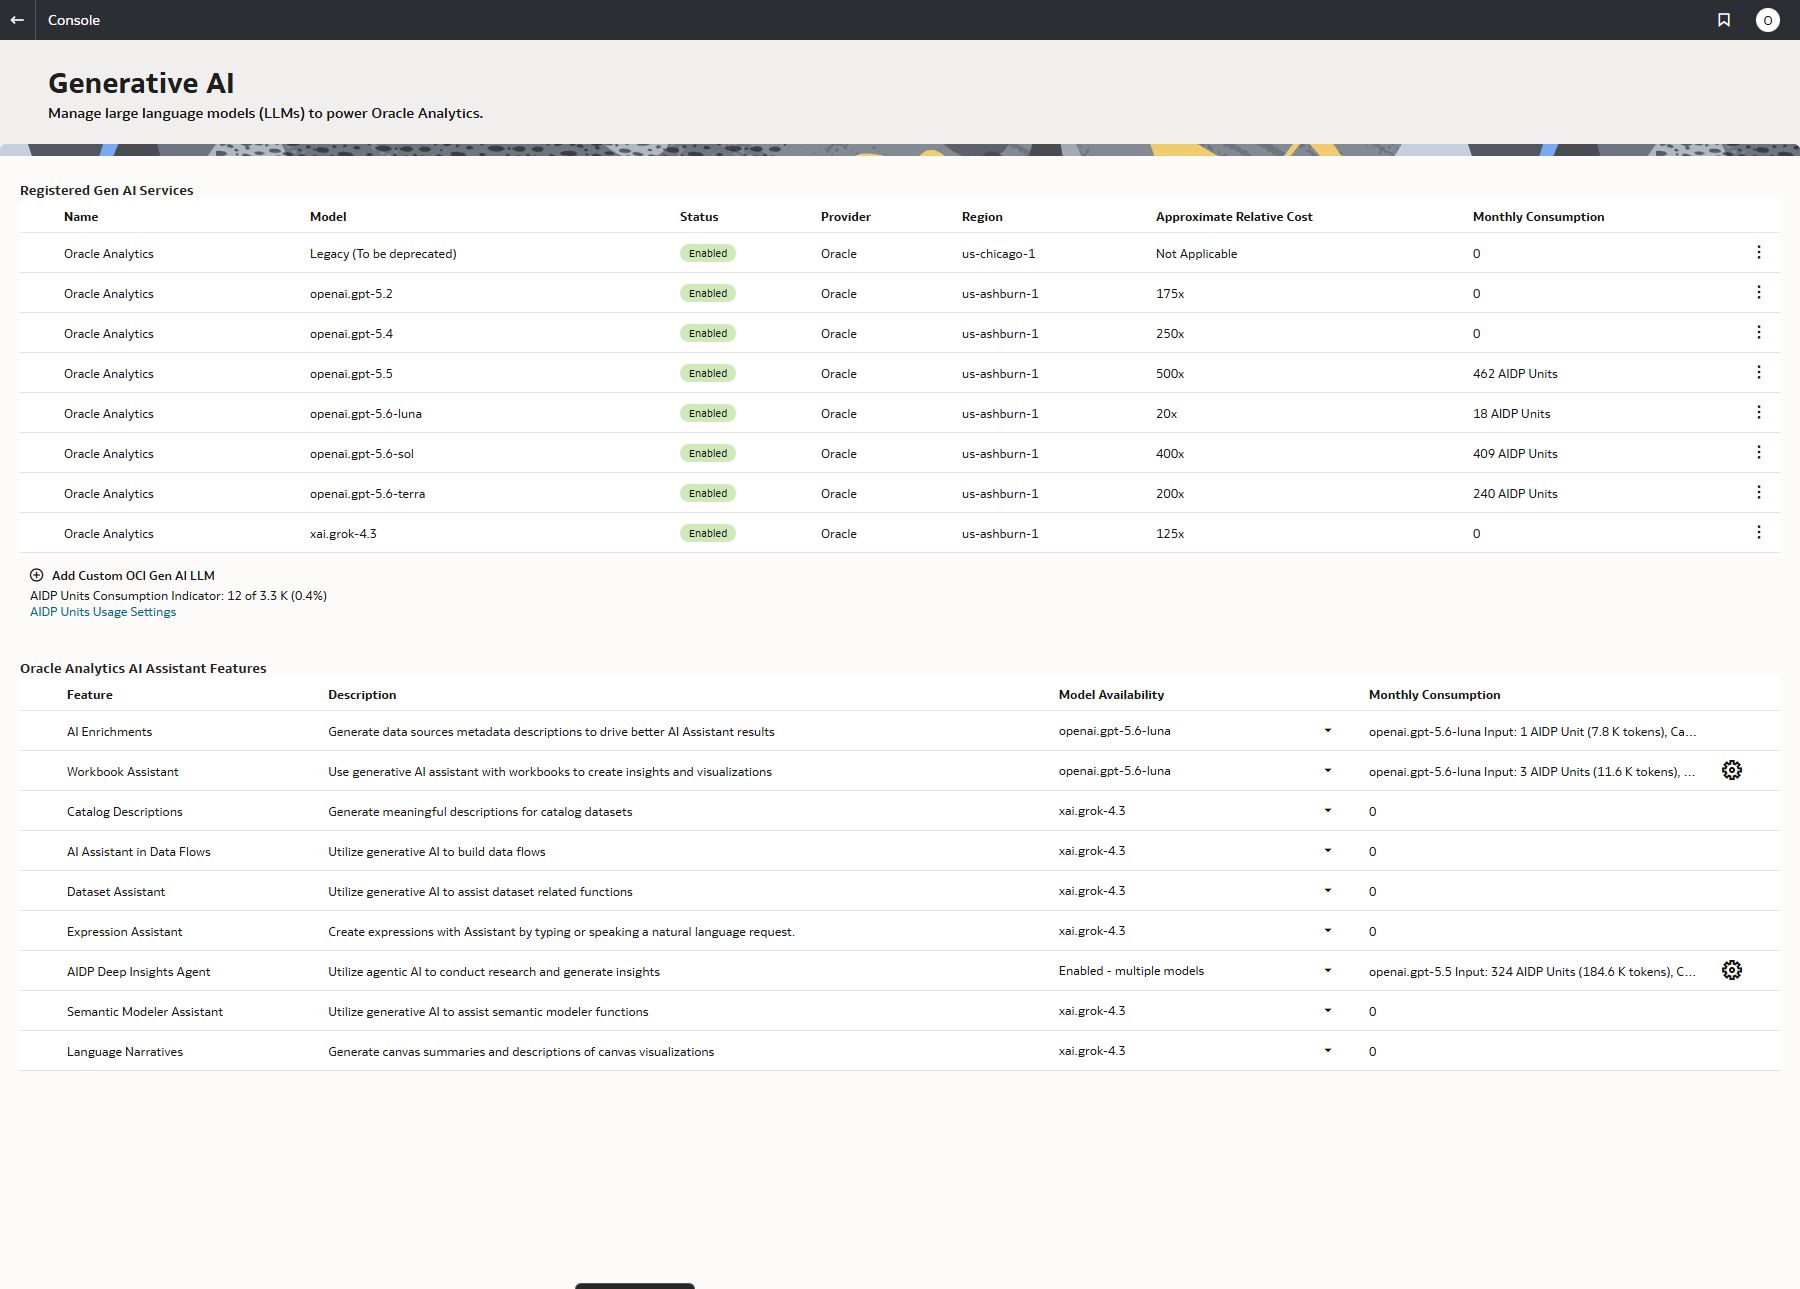
Open Navigator → Console → Generative AI to inspect the Deep Insights feature, model availability, monthly AIDP Unit consumption and limits. If OCI Logging is enabled, match a Deep Insights log entry to the run by time and available identifier, then inspect its model, mode, reasoning effort, duration and reported usage. The Console total is broader than one conversation.
| Evidence | Answers which question? | Who normally reviews it? |
|---|---|---|
| Thinking Events + conversation JSON | What data and tools did this run use, and did each step succeed? | Participant and agent author |
| Response feedback | Where did a user see value or a problem? | Agent owner and administrator |
| Generative AI Console | How much feature/model usage accumulated in the displayed period? | Administrator |
| Oracle Cloud Infrastructure (OCI) log | What run context, duration and usage were recorded for a correlated event? | Administrator with logging access |
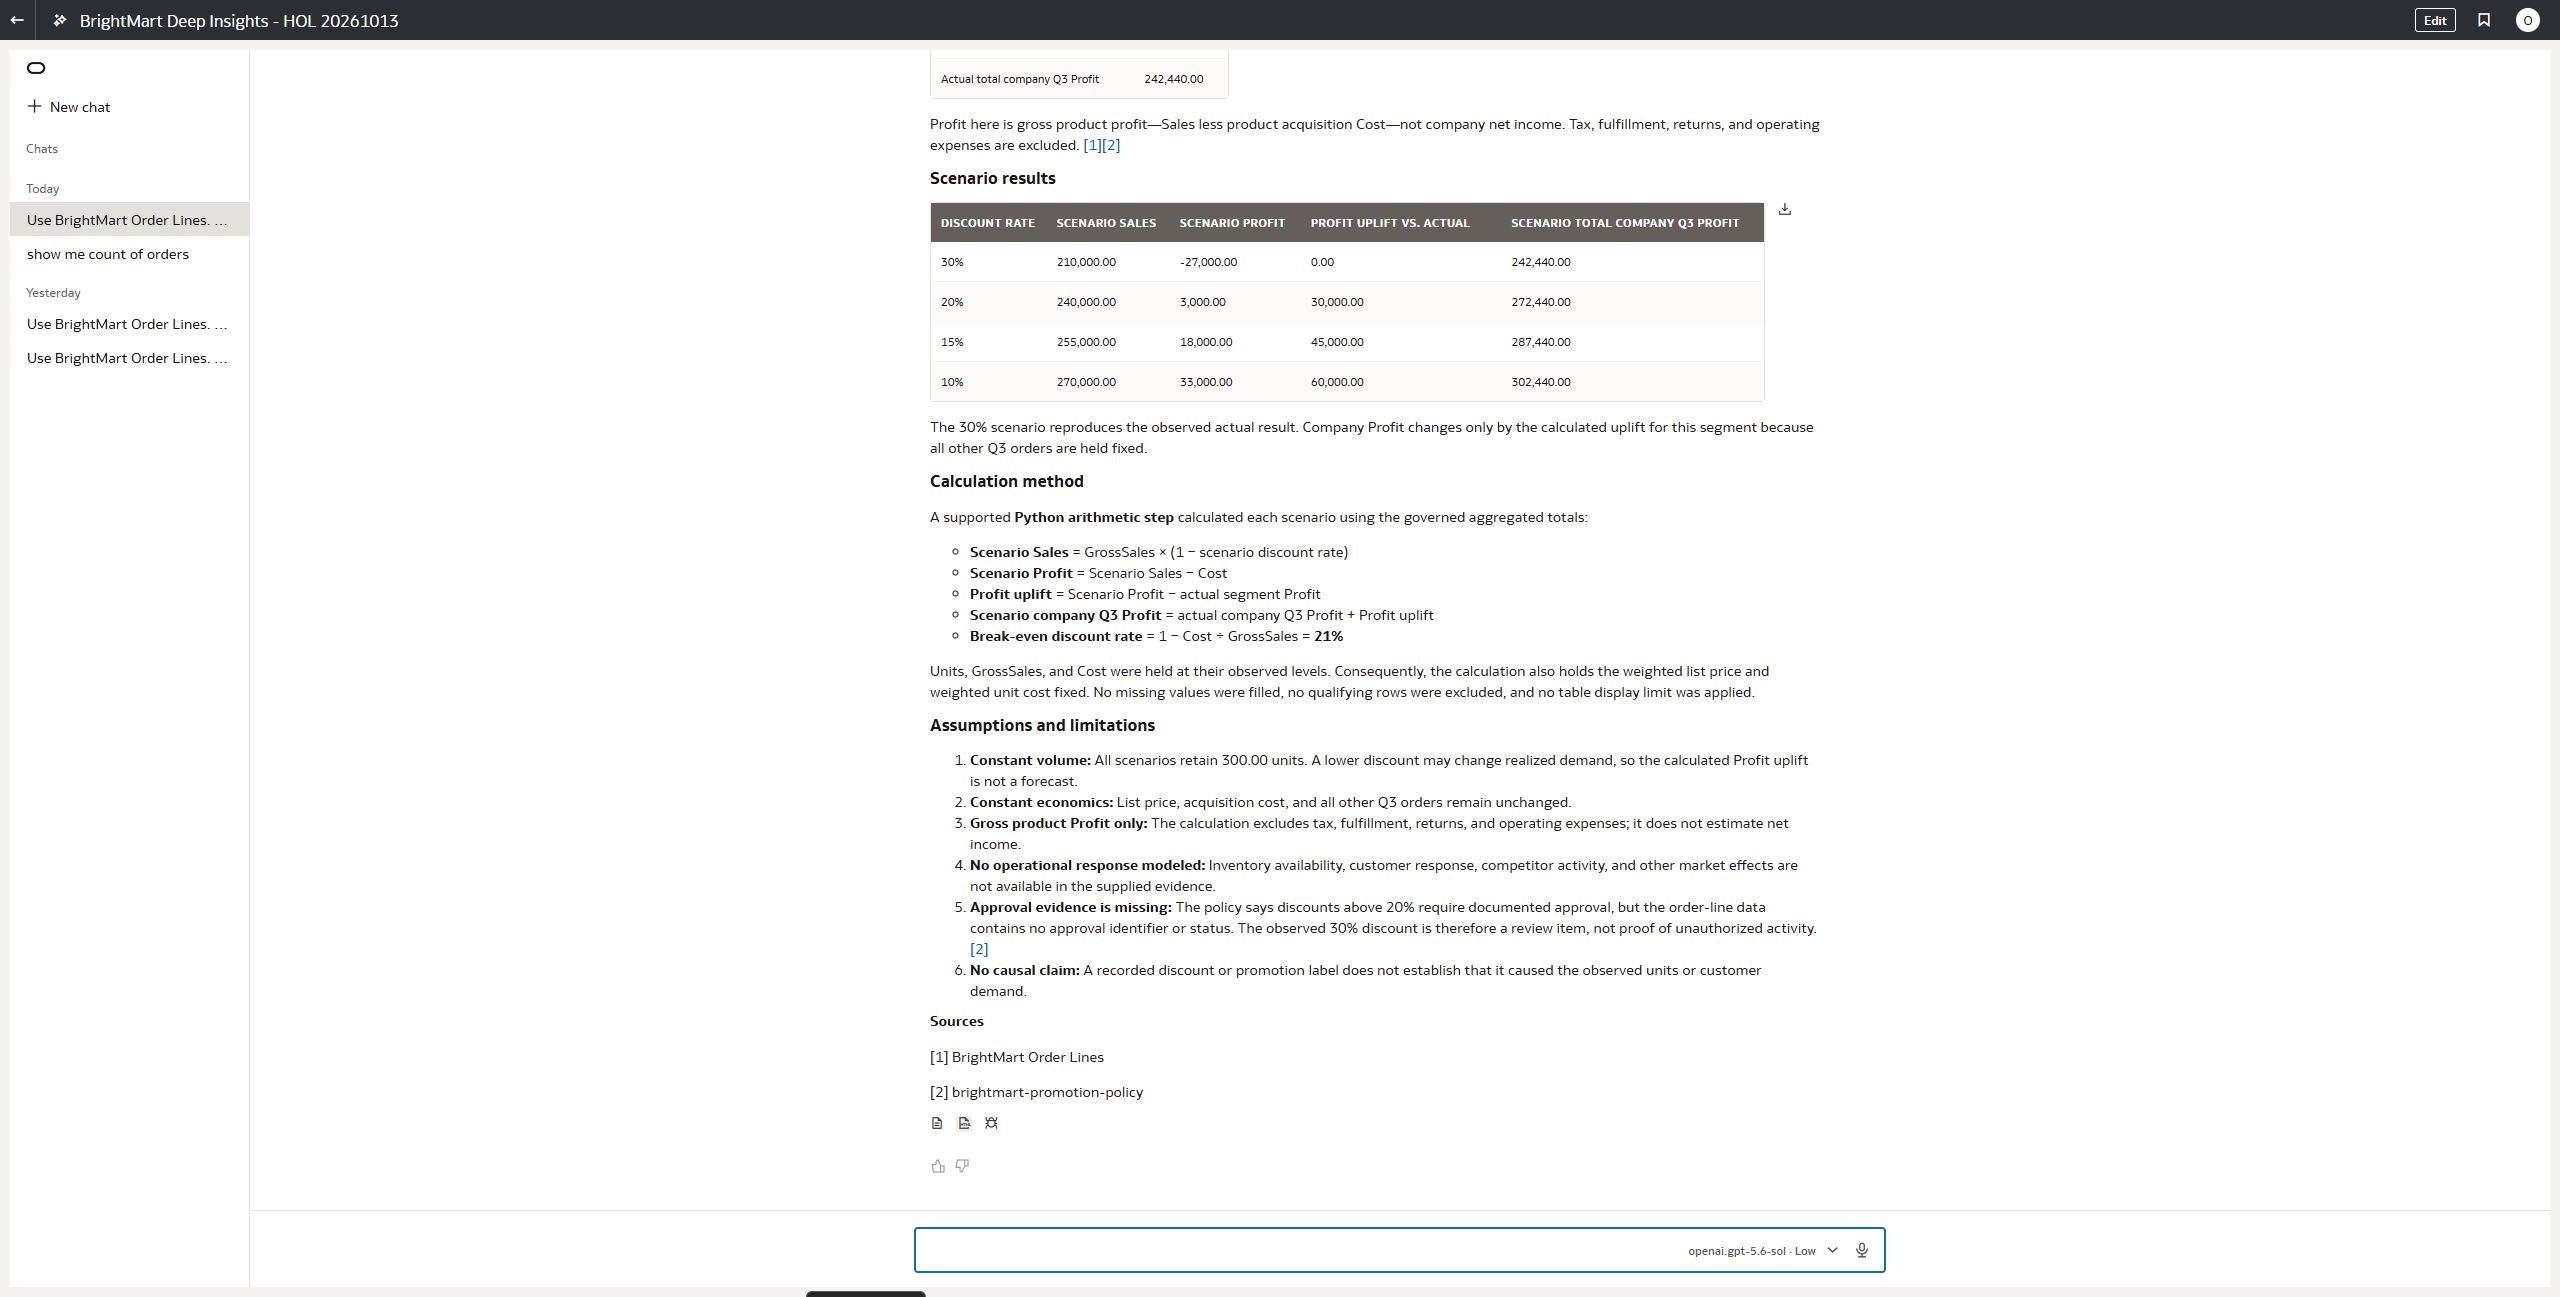
Instructor demonstration: Show the response action icons and feedback controls beneath the Case 3 report, open the actual debug export if available, then show the Console screenshot below. Demonstrate OCI logs only in an environment with logging configured and permission to read them. Keep downloaded prompts, results and identifiers in an approved workshop location.
Further reading: Oracle Analytics audit and diagnostic logs, including GenAI feedback · Monitoring AIDP Unit usage. Philippe and Lalitha's overview shows the conversation JSON, usage summary and OCI logging workflow; the exact fields and controls depend on the instance.
Keep the measures distinct
The report and conversation JSON describe one investigation. Console shows aggregated feature/model usage for its displayed period. A correlated OCI log describes a recorded event. Token counts, AIDP Units and approximate relative cost are different measures; do not treat any of them as a per-prompt dollar charge without the corresponding billing data.
FROM INSIGHT TO ACTION
Where should BrightMart act first?
Use the evidence to prioritize a review, test a pricing option and track recovery.
Observed BrightMart finding
Sales increased $296,390 while gross product Profit fell $66,360 from Q2 to Q3. Laptops, Accessories and Headphones had the largest category Profit declines. West / Online Laptops moved from $19,000 to −$27,000 Profit. Q3 Profit missed the regional targets by $87,560, with a $65,840 West shortfall. The recorded 30% offer crossed the policy's standard 20% threshold.
Decision and next actions
1 · PRIORITIZE WEST
Review West / Online Laptops first. Its segment Profit moved by −$46,000, and West accounts for $65,840 of the regional target gap. Assign pricing and product-cost owners.
2 · TEST THE 20% OPTION
Use a controlled commercial test. The fixed-volume scenario adds $30,000 Profit, taking company Q3 Profit to $272,440; it still leaves $57,560 against the $330,000 target. Track actual units and Profit before rollout.
3 · APPLY PROMOTION GOVERNANCE
Send the 30% offer to the commercial owner for an approval-record review and document the outcome. The order data establish an above-threshold discount, not the approval decision.
4 · MEASURE RECOVERY
Monitor weekly Profit, Units, weighted discount and weighted unit cost for West / Online Laptops, plus regional Profit against target. Review Accessories and Headphones in parallel.
Direct metric → Data AgentMulti-step diagnosis → DIPython → when useful and observedRAG → shared policy capabilityConclusion → bounded by evidence
These are synthetic, previously validated aiw2 results, not a promise that every live run will use the same tools or wording. A 20% fixed-volume discount produces $3,000 segment Profit and $272,440 company Q3 Profit arithmetically; it is not a demand forecast. Above-threshold is not proof of unauthorized activity.